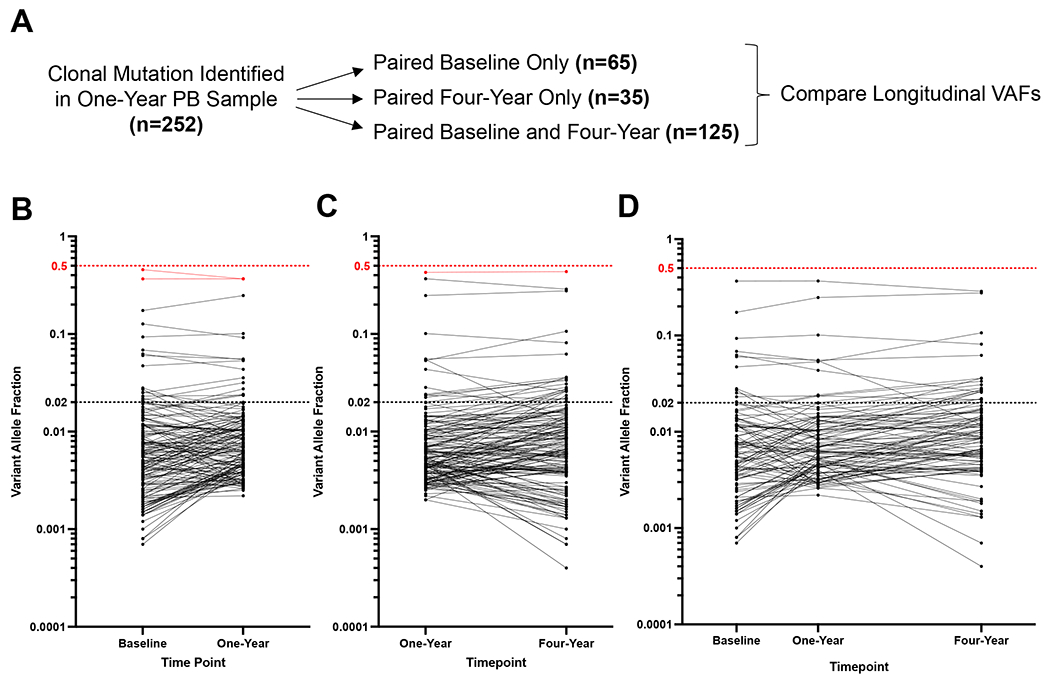
Fig. 3: Longitudinal Mutation Analysis in the YWS.

(A) Schematic of longitudinal sample acquisition and sequencing.
(B-D) Change in variant allele fraction (VAF) for mutations identified in paired samples. The VAF for all mutations identified in the baseline and one-year samples (B), one-year and four-year samples (C), or baseline, one-year, and four-year samples (D) are plotted. The horizontal dashed line at VAF 0.02 reflects the cutoff for CHIP.
Note that mutations presented are only in genes assessed on both of the sequencing panels used at the different time points (see Supplemental Tables 1 and 2).
