
Figure 6.
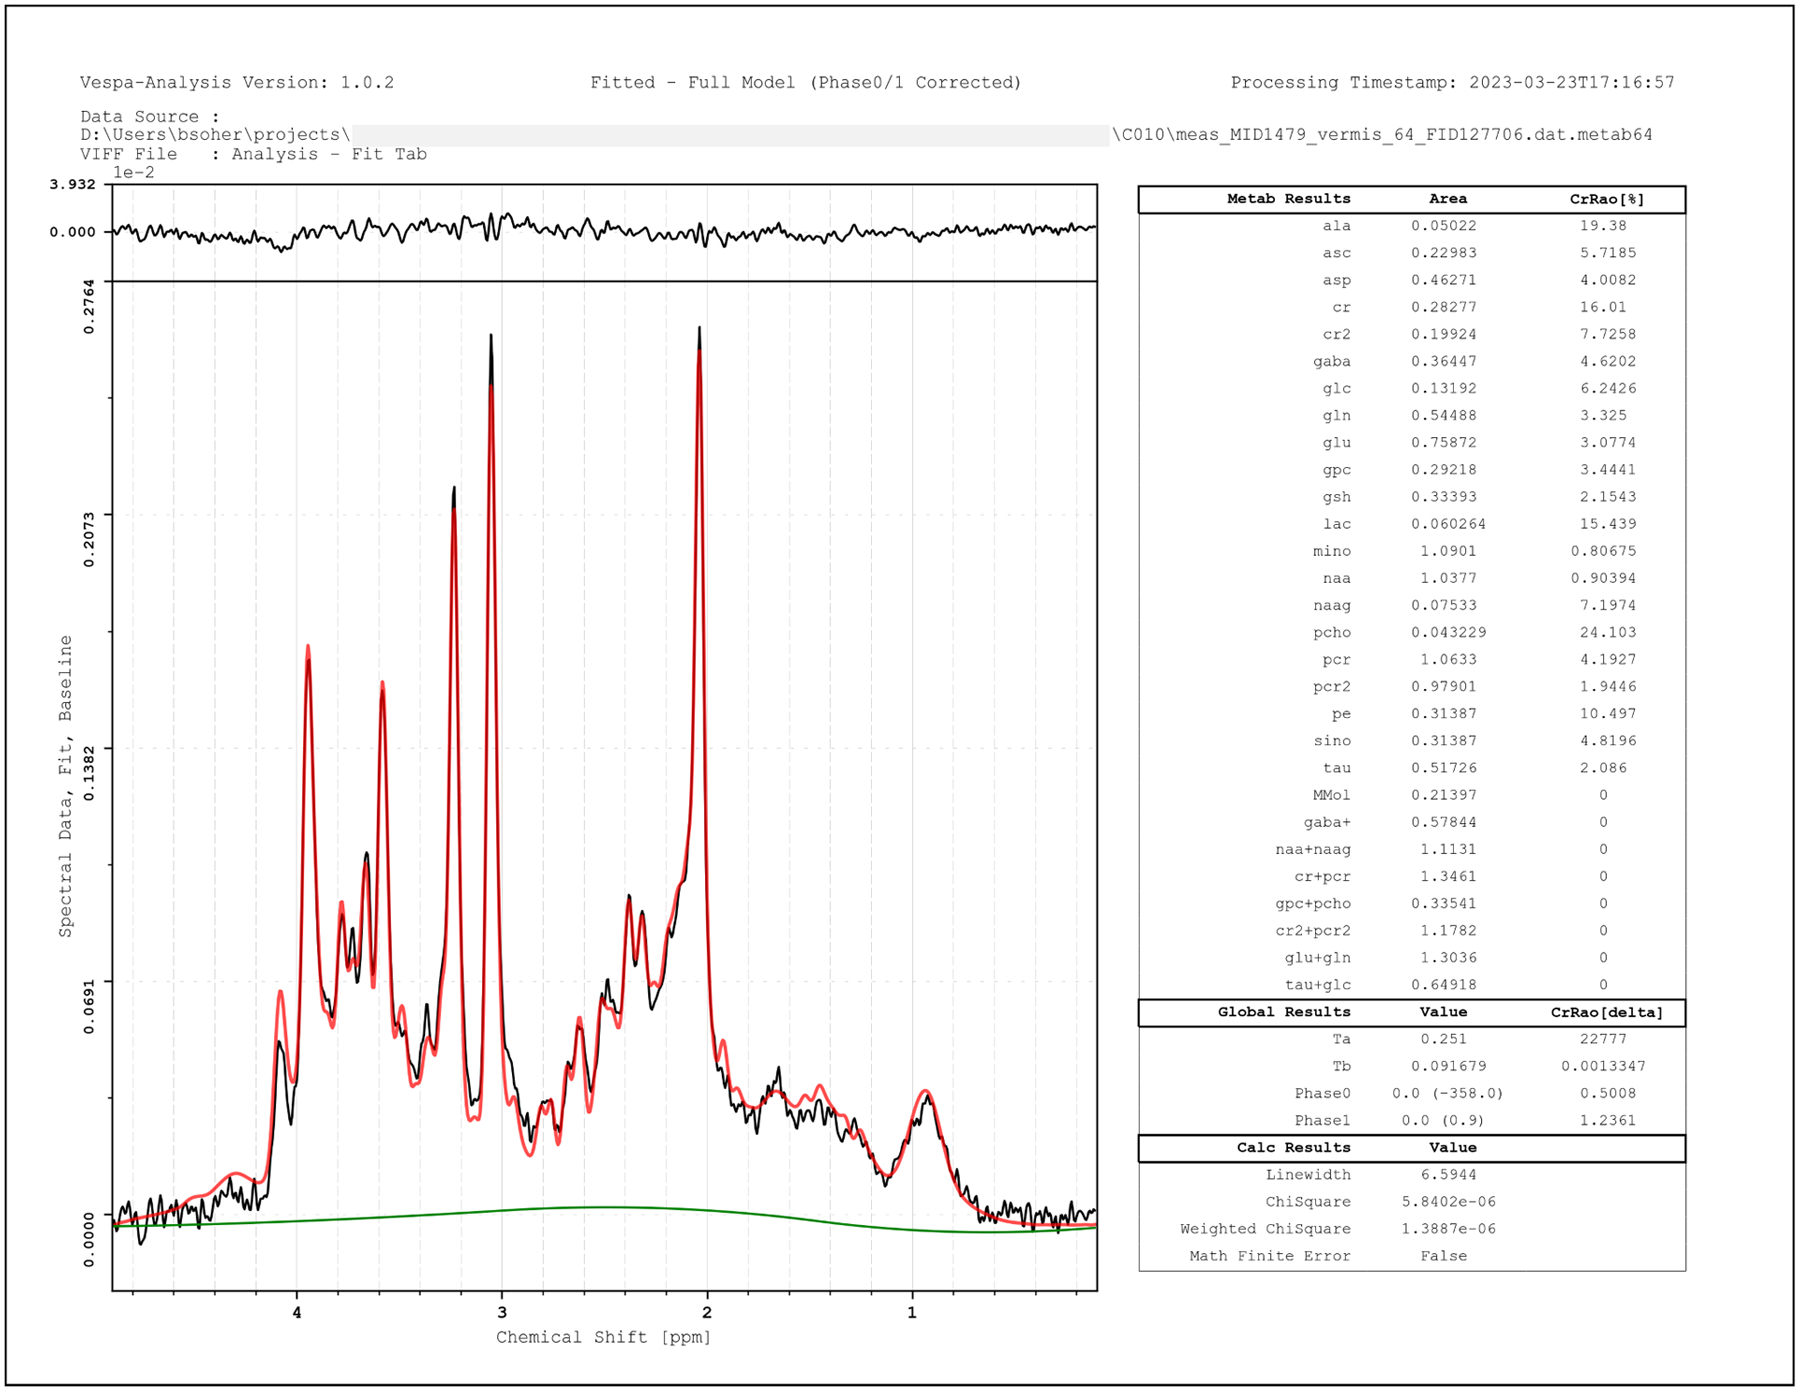
Analysis results output to PNG format for Siemens SVS semi-LASER data, TE=28ms. Data is plotted in black, full fitted model in red overlay, the baseline model only in green. Metabolite concentrations and other fit statistics in table (right). This traditional LCModel style format is just one of many visual (PDF, SVG, EPS, PNG) and tabular (CSV, XML) output options.