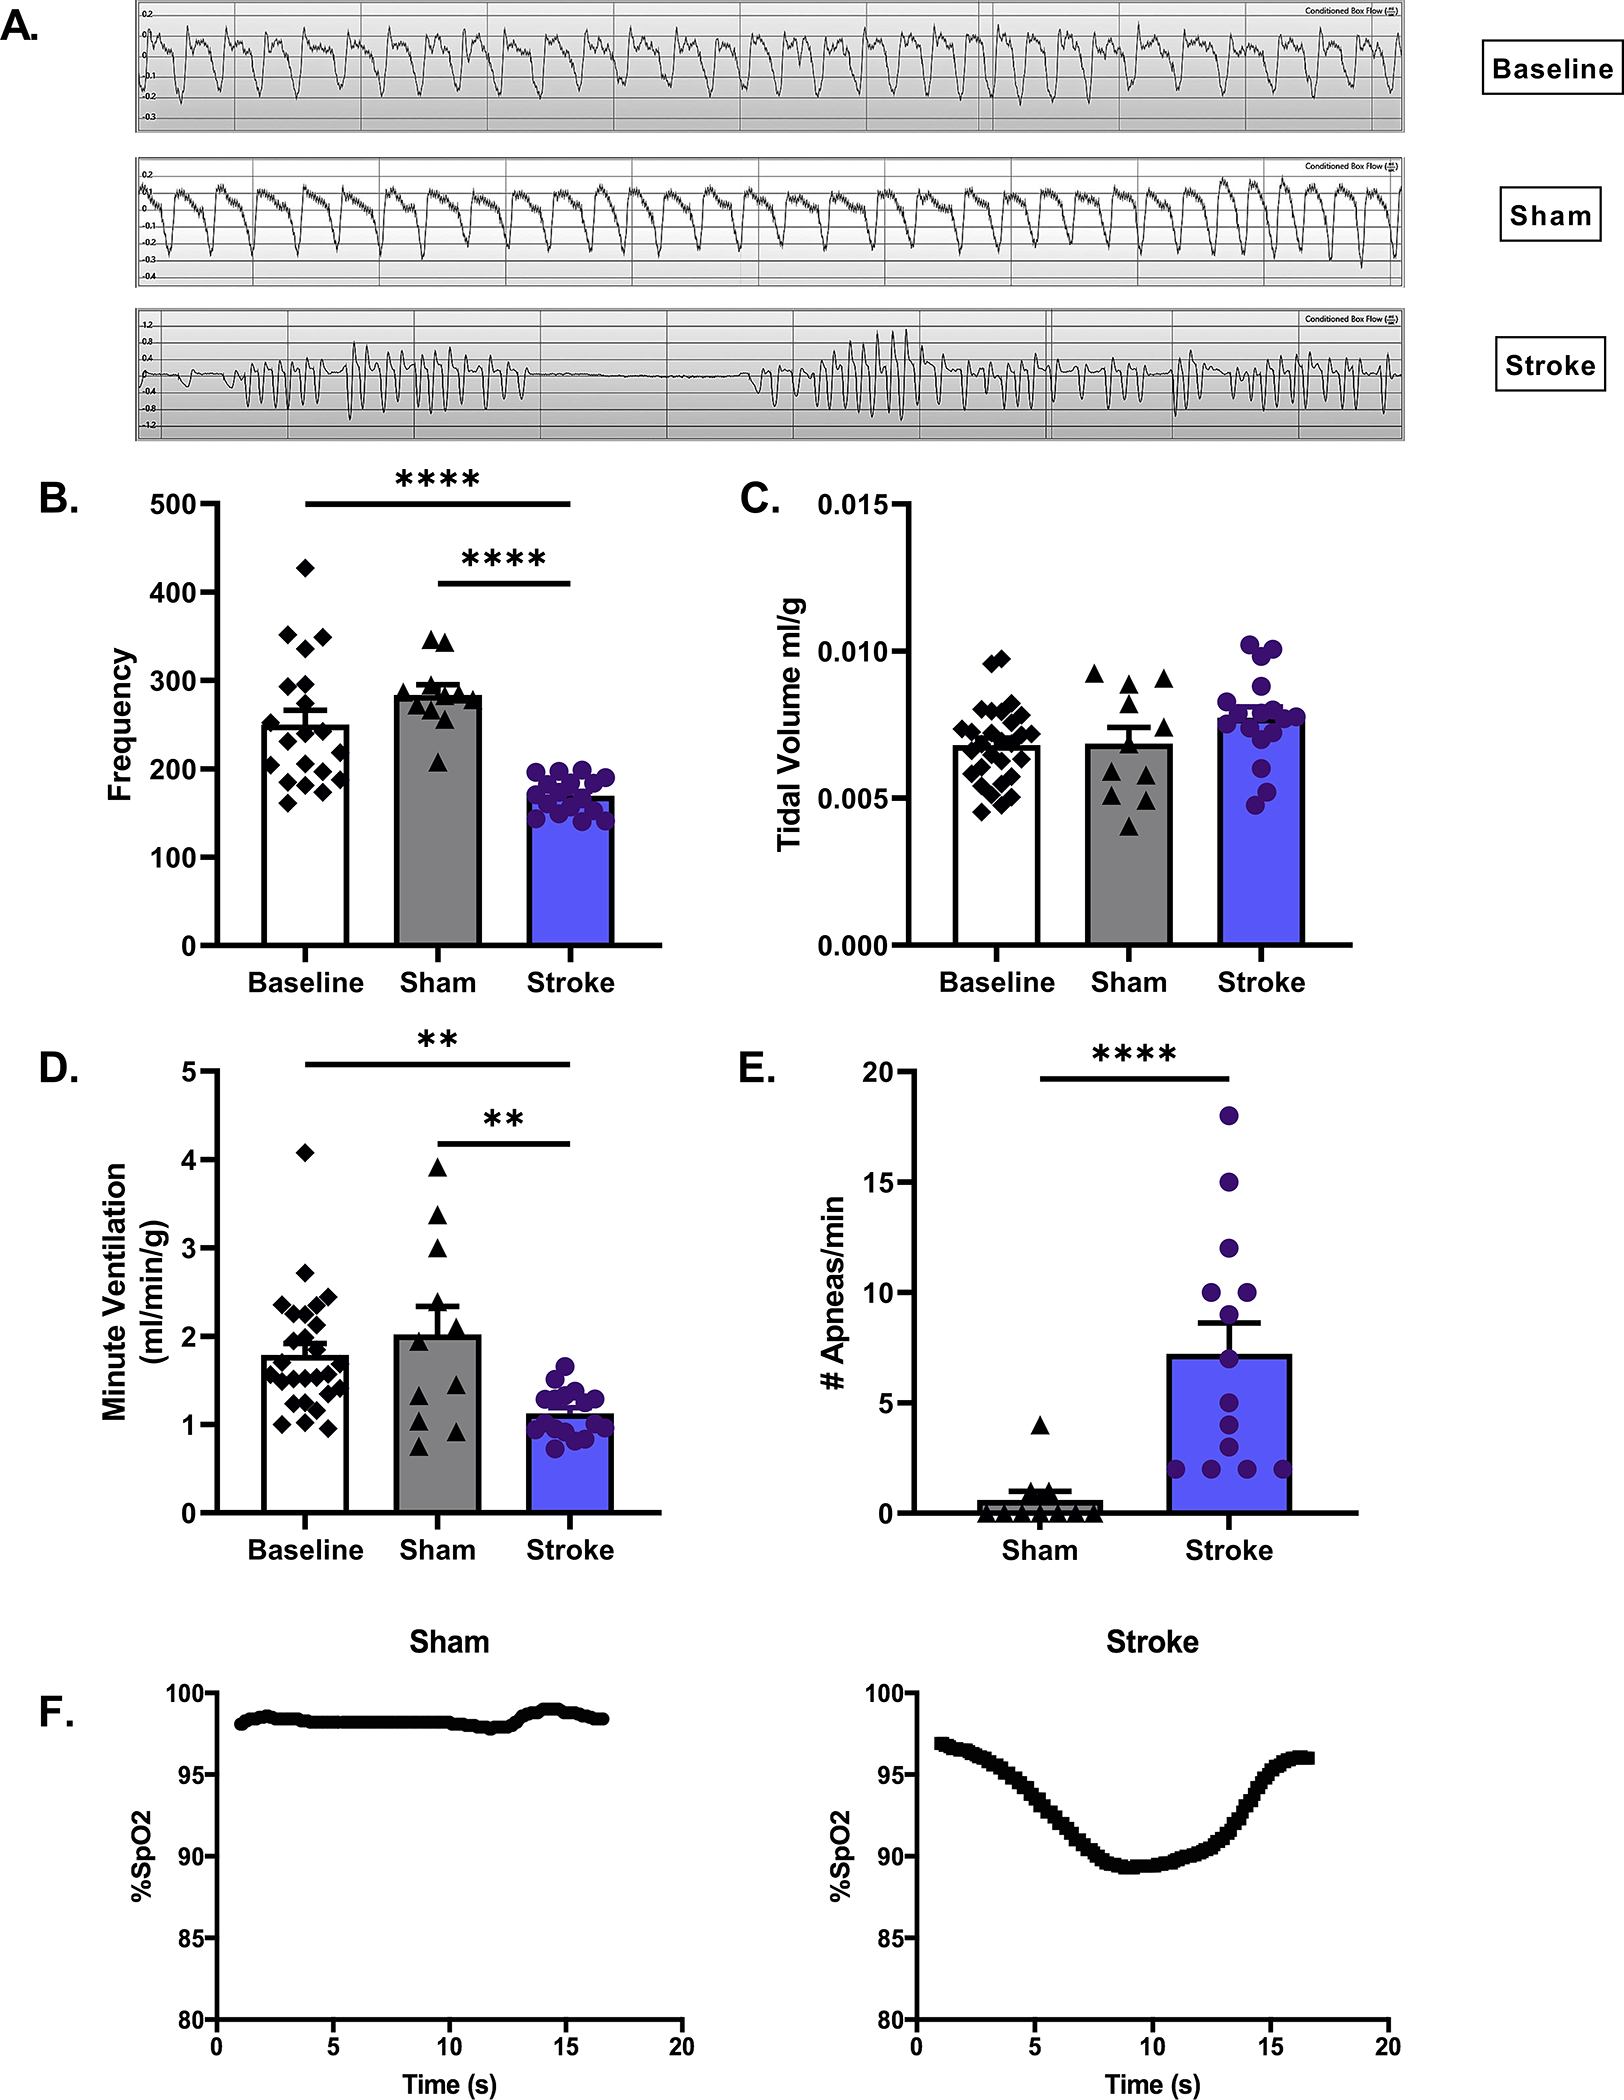
Figure 1. Phenotype of stroke-induced respiratory dysfunction.

Whole body plethysmography was performed on stroke and sham young male mice day 3 post surgery. Representative respiratory waveform tracings of mice at baseline, sham and stroke are shown at 1 second intervals (A). Under room air conditions respiratory frequency, measured in breaths per minute, decreased in stroke compared to baseline & sham p<0.0001, (B), while TV (ml/g) increased although not significantly, p=0.28 (C). The product of frequency and TV, MV (ml/min/g), decreased, following MCAO, suggesting hypoventilation, p<0.01 (D). Number of apneas per minute markedly increased following stroke, Mann-Whitney test, p<0.0001 (E). B-E: stroke n=14–17, sham n=10–11 Stroke mice showed hemoglobin O2 saturation (SpO2) levels fluctuating between 94–96% but would frequently drop to between 80–90% during apneic events (F).
