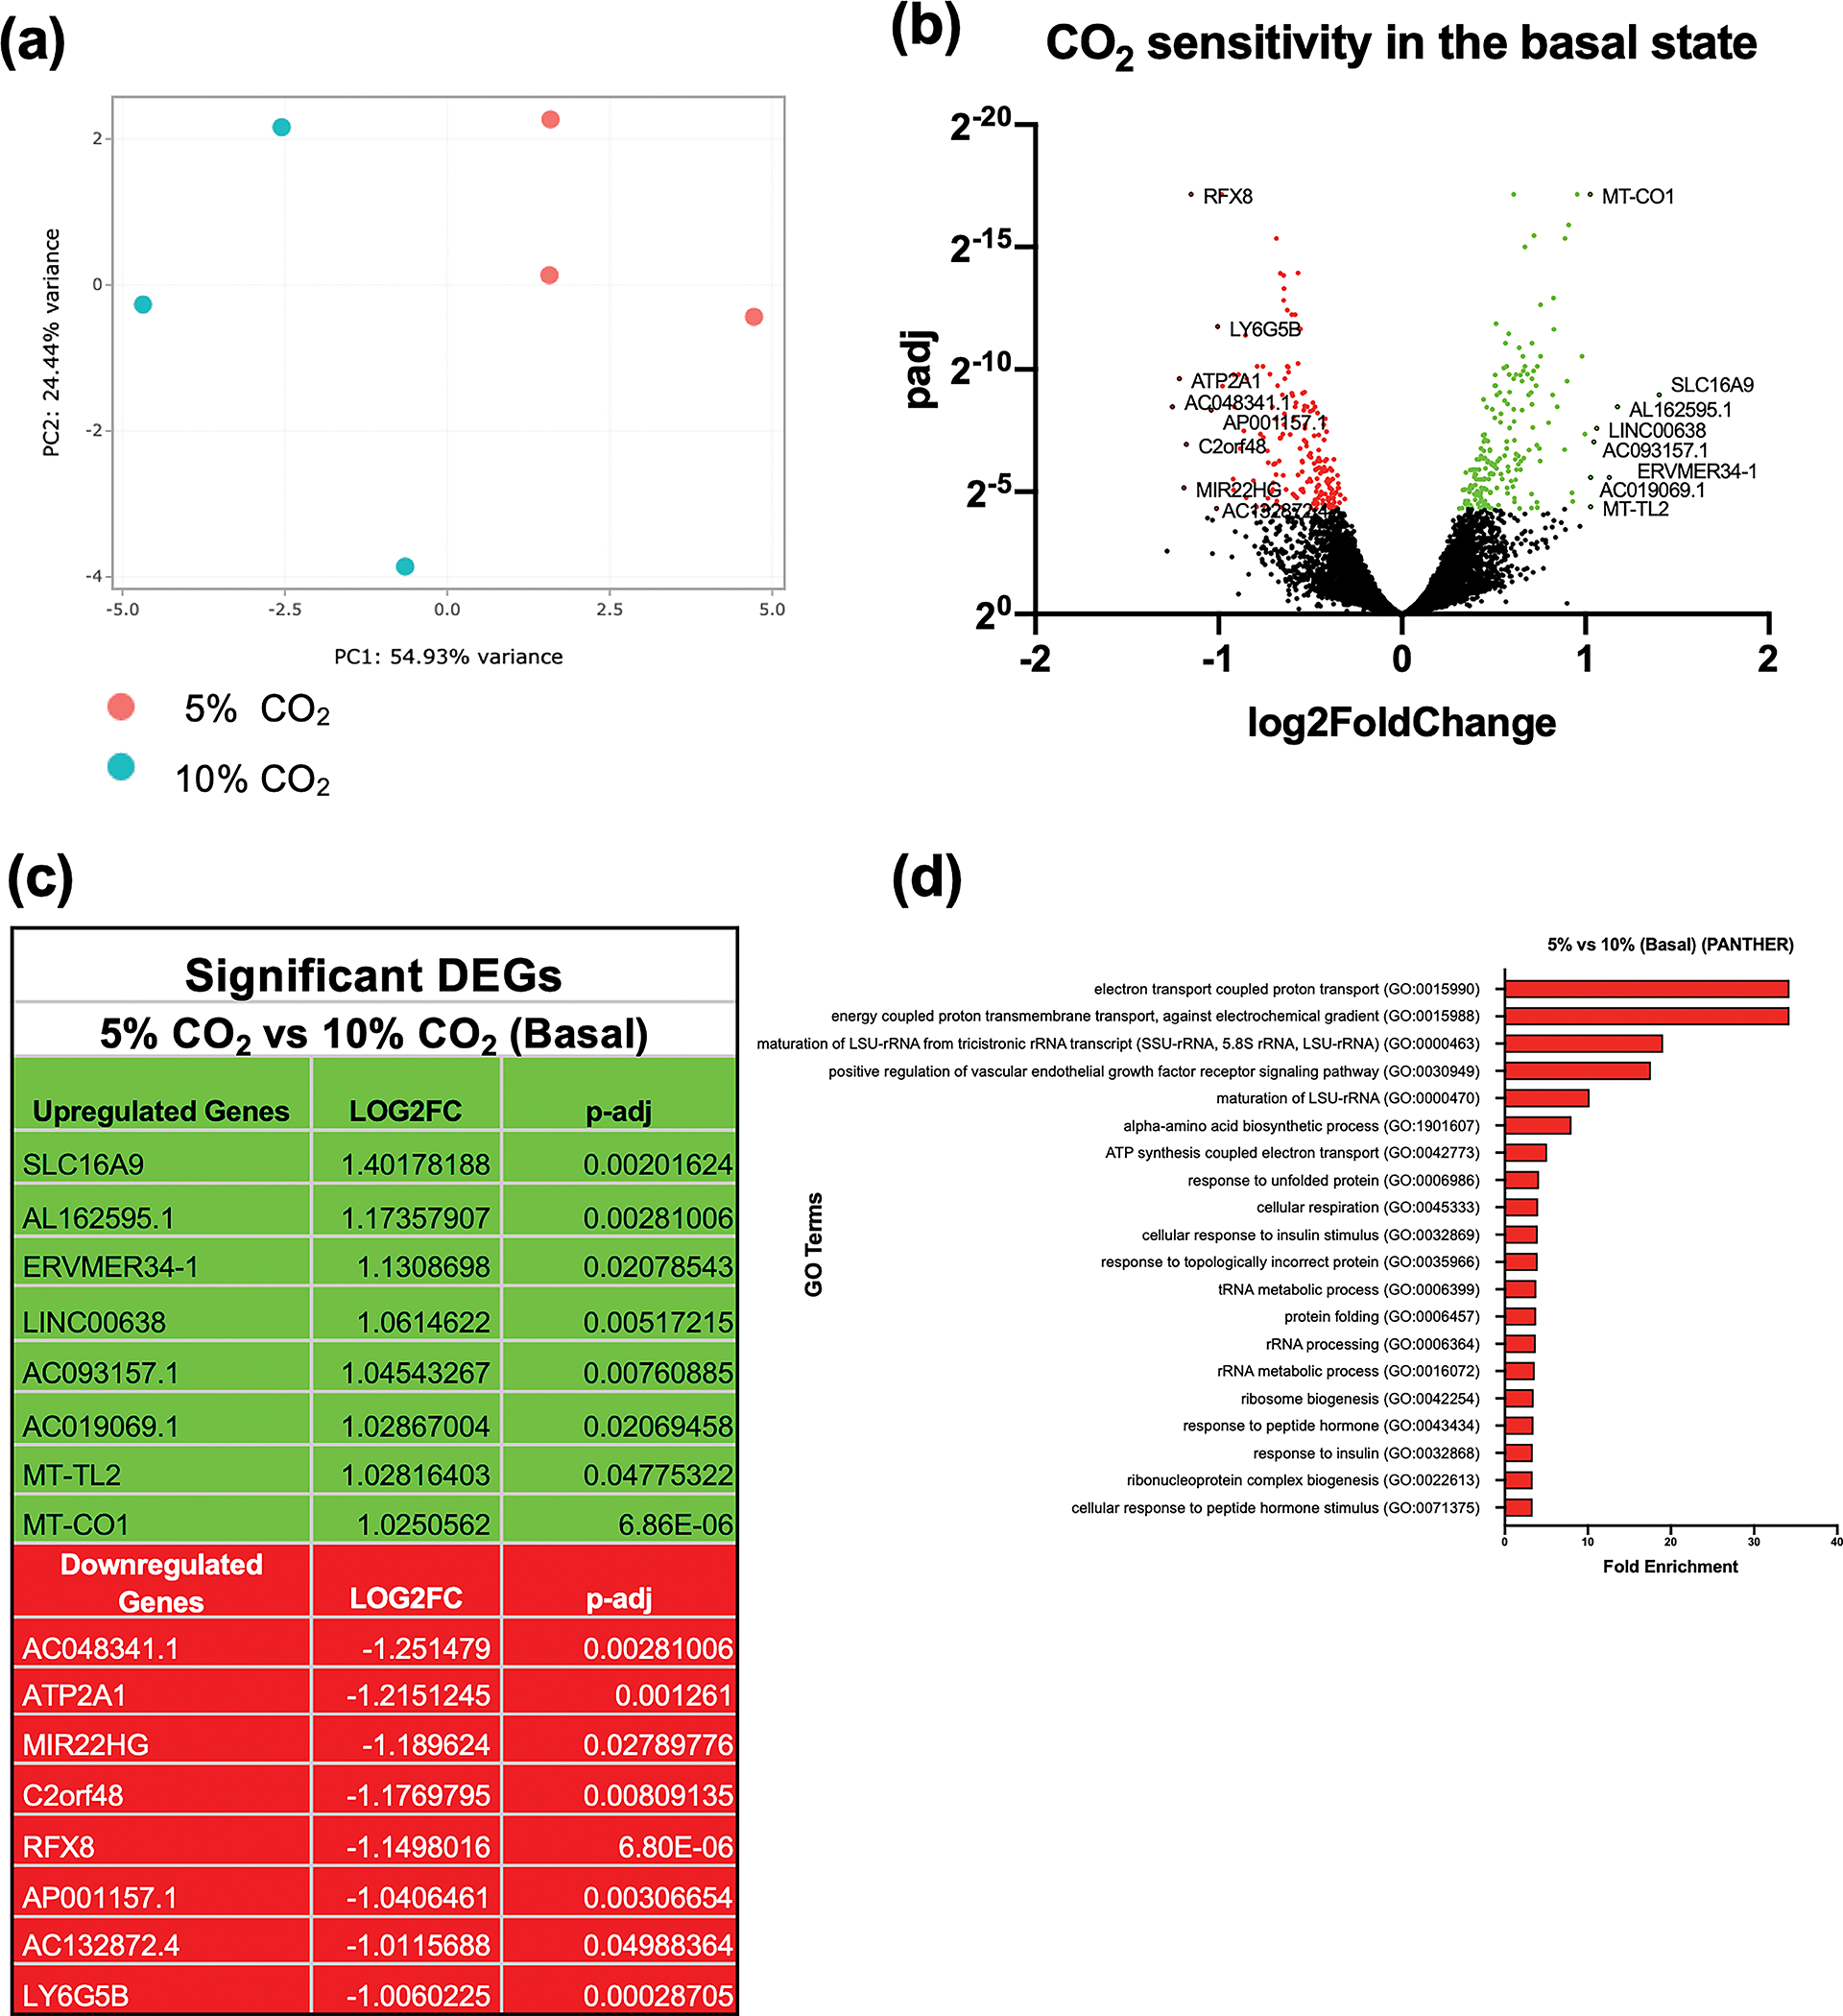
Figure 1. RNA-seq analysis of THP-1 monocytes exposed to buffered hypercapnia for 4 h.

Principal component analysis of THP-1 cells exposed to 5% CO2 (red) or 10% CO2 (blue) for 4 h. The x-axis (PC1) is the vector that displays the most variance between samples and the y-axis (PC2) displays the second most. The percentage of total variance per principal component is shown on the axis label. Data are representative of n = 3 independent experiments (a). Volcano plot of differential expression between 5% and 10% CO2 in the basal state (4 h). The cut off for significance (P-adj < 0.05) is shown with a solid line on the y-axis. Significantly upregulated genes are shown in green and downregulated genes are shown in red (b). List of the 8 most significantly differentially expressed genes (up (green) and down (red)) in hypercapnia in the basal state. Includes all genes with a Log2FC of ± 1 and P-adj of < 0.05 (c). The top gene ontology terms associated with significantly differentially expressed genes in hypercapnia in the basal state (10% CO2 for 4 h) using a cut off value for significance of P-adj < 0.05. Terms are ranked by fold enrichment (d). Data are representative of n = 3 independent experiments in all cases (a–d).
