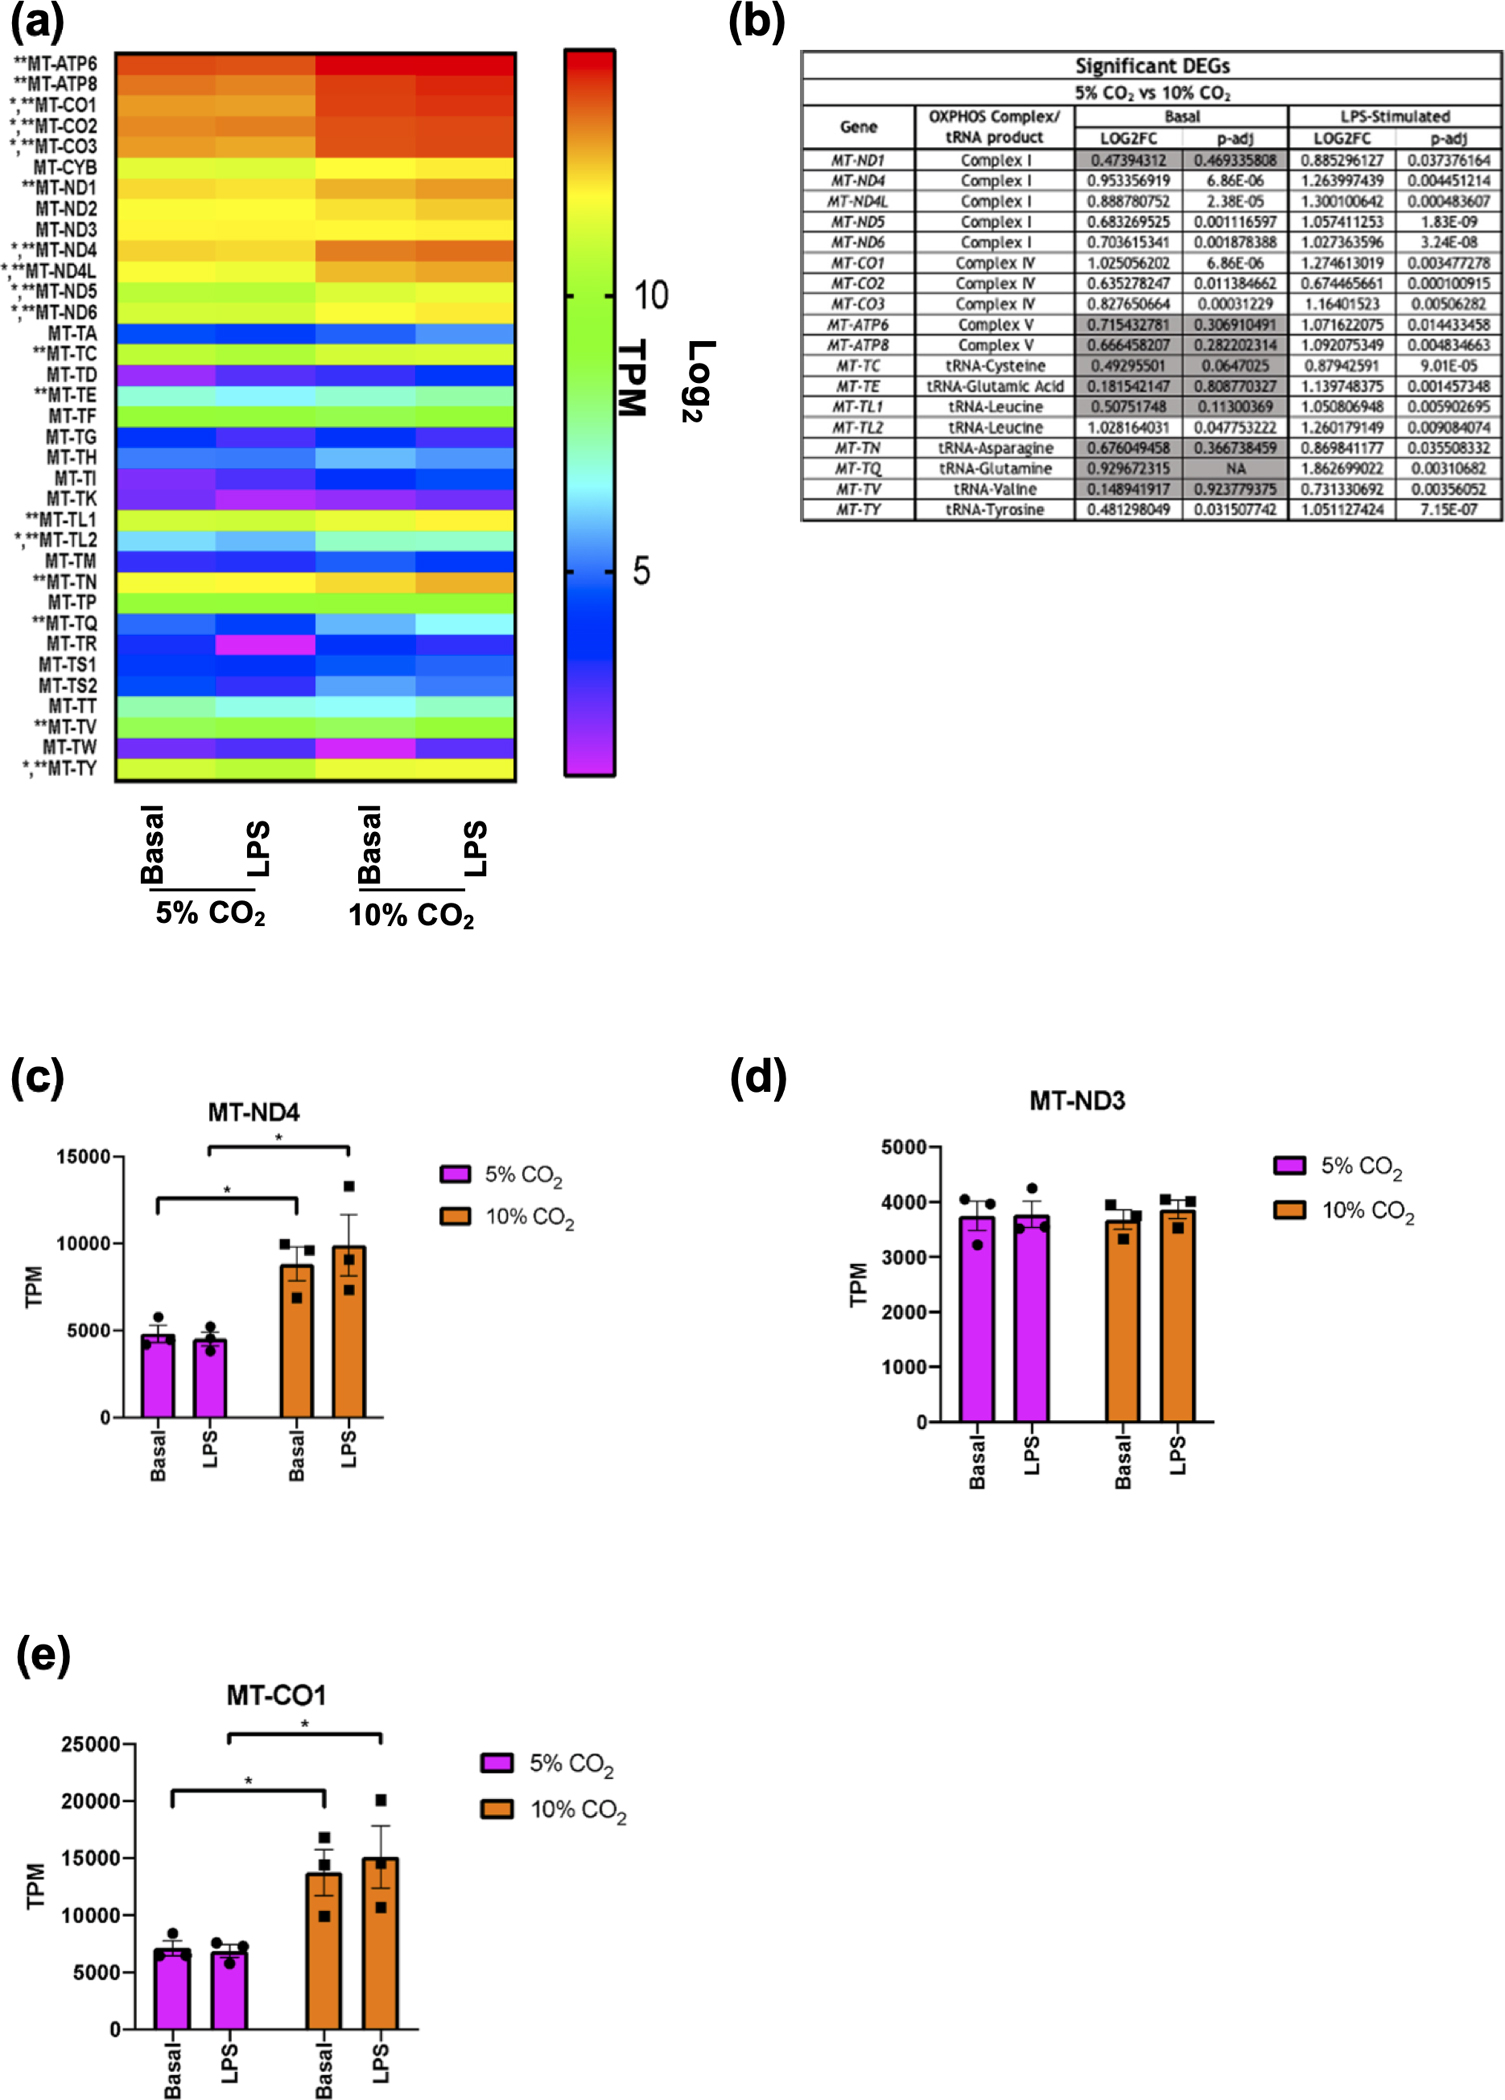
Figure 3. Monocyte mitochondrial gene expression in hypercapnia.

Heat map of all detected mitochondrially-encoded genes in THP-1 cells exposed to 5% or 10% CO2 for 4 h ± LPS (2.5 μg mL−1) for 2 h. Expression is displayed as Log2 of TPM. Significantly differentially expressed genes in hypercapnia in the basal state are denoted by (*). Significantly differentially expressed genes in hypercapnia the LPS stimulated state are denoted by (**) (a). List of significant differentially expressed mitochondrial genes in hypercapnia in basal and LPS stimulated states. Non-significant results in the basal state are shown in grey (b). Raw TPM values extracted from RNA-seq data for MT-ND4 (c), MT-ND3 (d), and MT-CO1 (e) in THP-1 cells in the basal (unstimulated) and LPS stimulated (2.5 μg mL−1 for 2 h) state in both 5% (pink) and 10% (orange) CO2 conditions (4 h). Data shown as mean ± SEM for n = 3 independent experiments. Significant differential expression from individual comparisons using DESeq2 analysis is denoted by (*).
