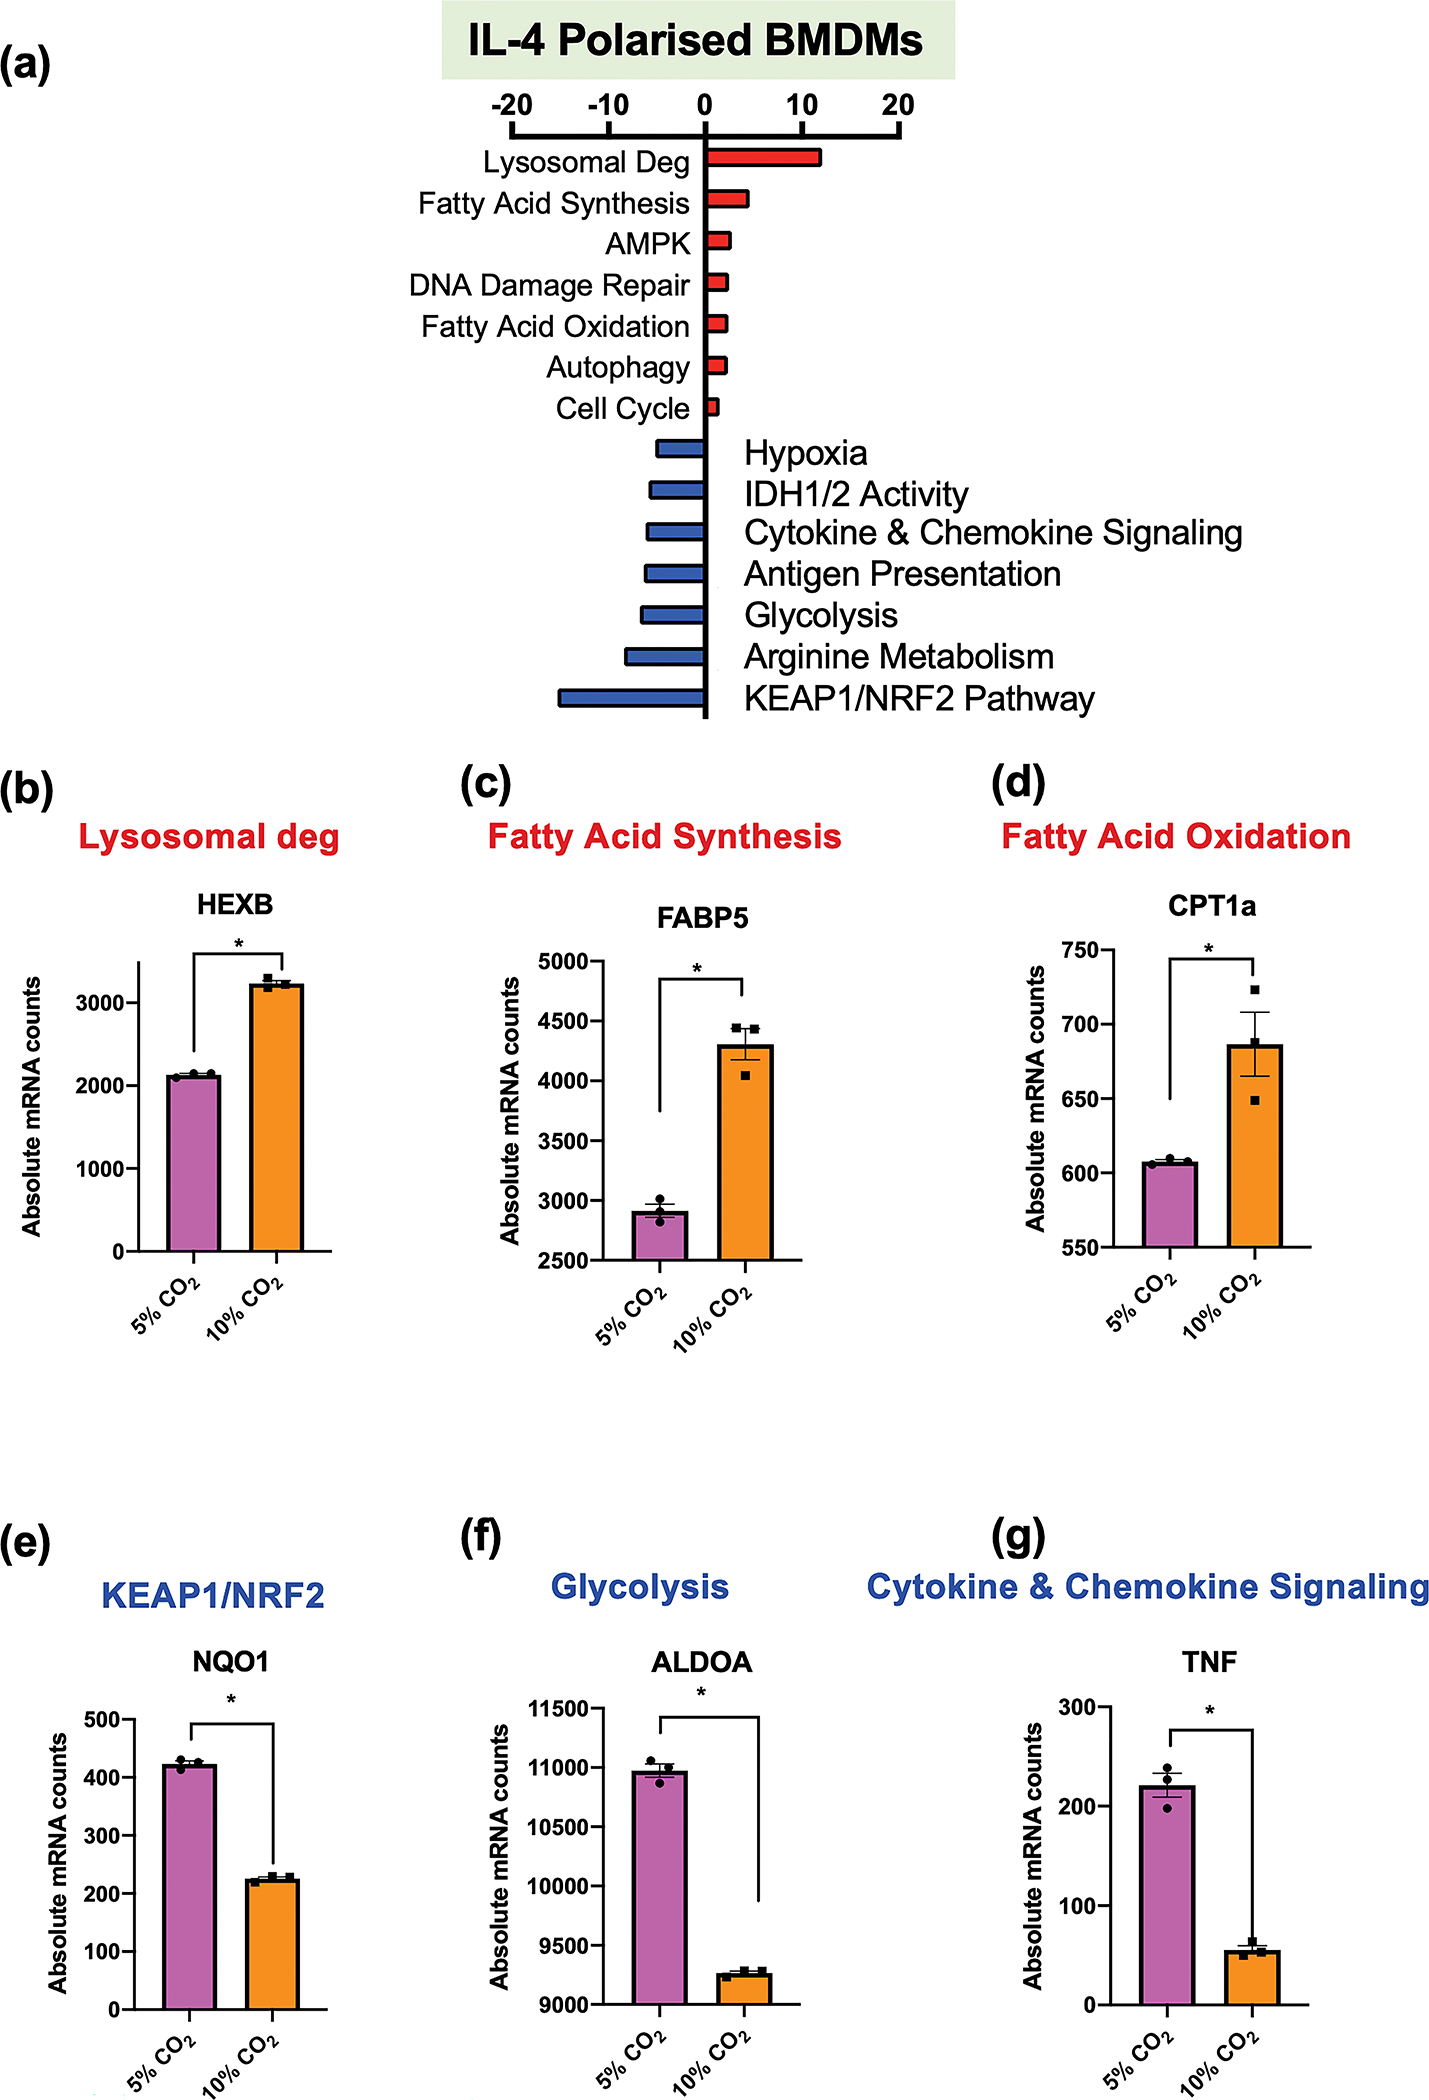
Figure 6. IL4 polarised BMDM response to hypercapnia.

Bone marrow-derived macrophages (BMDMs) were exposed to 5% (pink) or 10% CO2 (orange) for 6h followed by IL4 (100 ng mL−1) stimulation for an additional 18h. Absolute mRNA levels and differential gene expression were assessed by a metabolic and inflammatory gene panel on the NanoString nCounter platform. Gene set enrichment analysis is presented (a). Absolute mRNA levels were measured for HEXB (b), FABP5 (c) CPT1a (d), NQO1 (e), ALDOA (f) and TNF (g). These are exemplar genes for pathways that are enhanced (red) or repressed (blue) in the NanoString gene set analysis. Data shown are mean ± SEM for n = 3 independent experiments. Significant differential expression from individual comparisons as determined by NanoString nCounter analysis, P-value ≤ 0.05 (*).
