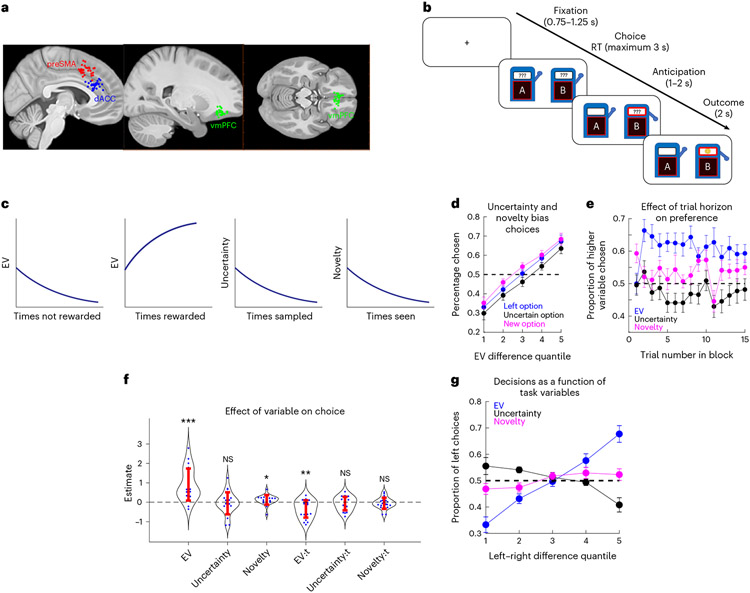
Fig. 1 ∣. Electrode positions, exploration task and behaviour.
a, Electrode positioning. Each dot indicates the location of a microwire bundle in the preSMA (red), dACC (blue) or vmPFC (green). b, Trials were structured according to fixation, decision, anticipation and feedback stages. In the actual task, slot machines were distinguished by artistic paintings displayed in front of them, represented in this figure by distinct letter labels. c, Schematic indicating how values, uncertainty and novelty of stimuli vary as a function of the past history of rewards, choices (‘sampled’) and exposures. d,e, Behaviour. d, EV correlates with choice, biased by novelty and uncertainty. Patients chose the left option (blue), the more uncertain option (black) or the newer option (magenta) as a function of chosen minus unchosen EV. n = 22 sessions. e, Proportion of trials in which patients chose the option with higher EV (blue), uncertainty (black) or novelty (magenta), as a function of trial number. The dots and bars indicate the mean and s.e.m., respectively. n = 22 sessions. f, Logistic regression coefficients for EV (P < 0.001), uncertainty (P = 0.639), novelty (P = 0.034) and interactions with trial number (EV:t, P = 0.001; uncertainty:t, P = 0.352; novelty:t, P = 0.369). The dots and bars indicate the fits for each patient and s.e.m., respectively (*P < 0.05; **P < 0.01; ***P < 0.001, two-sided t-test). Positive values indicate seeking behaviour. g, Decision as a function of task variables. The lines indicate the proportion of left choices as a function of the difference in the variable of interest between left and right stimuli (EV: blue; uncertainty: black; novelty: magenta). All error bars indicate the s.e.m.

