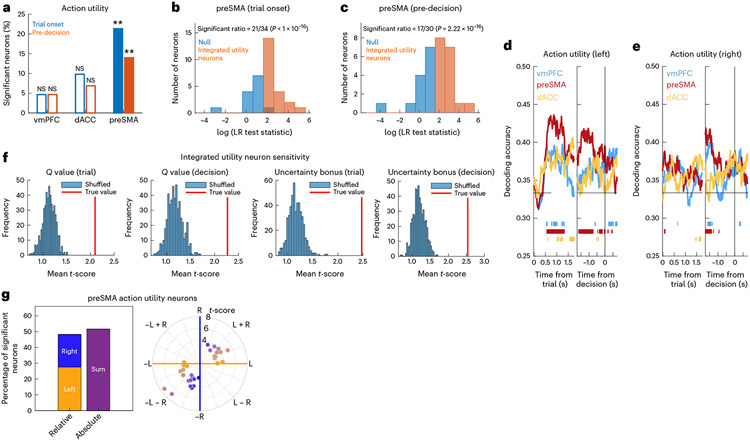
Fig. 3 ∣. Neurons in the preSMA encode integrated utility.
a, Percentage of action utility neurons in the vmPFC, dACC and preSMA at the trial onset (blue, preSMA: P = 0.002) and pre-decision (orange, preSMA: P = 0.002) periods (**P < 0.01, one-sided permutation test). The unfilled bars indicate non-significant counts. b, LR test statistics across candidate preSMA integrated action utility neurons at the trial onset period. Neurons whose activity was better explained by a model containing values and uncertainty bonuses were classified as integrated utility neurons (orange). For the remaining neurons (blue), the null model restricted to values was not rejected. c, Same but for the pre-decision period. d, dPCA population decoding performance for the left action utility for the vmPFC (blue), preSMA (red) and dACC (yellow). The bars indicate periods of time where decoding accuracy was significantly above chance. The horizontal line indicates chance. Left, trial onset period. Right, pre-decision period. e, Same but for the right action utility. f, Integrated utility preSMA neuron sensitivity to values. The red lines indicate the mean absolute t-score across integrated utility neurons. The histograms include the mean absolute t-scores for 500 iterations of bootstrapped null models with shuffled firing rates. Tested variables (from left to right): value (trial onset); value (decision); uncertainty bonus (trial); uncertainty bonus (decision). g, Left versus right coding in sensitive preSMA action utility neurons. Left, percentage of neurons coding left, right or sum values. Right, polar plot for left (yellow), right (blue) and mixed (purple) -value coding. The colours indicate the degree of left (yellow), right (blue) or mixed (purple) coding. The radial lines indicate the separation used for neuron classification as right, left, sum or difference.

