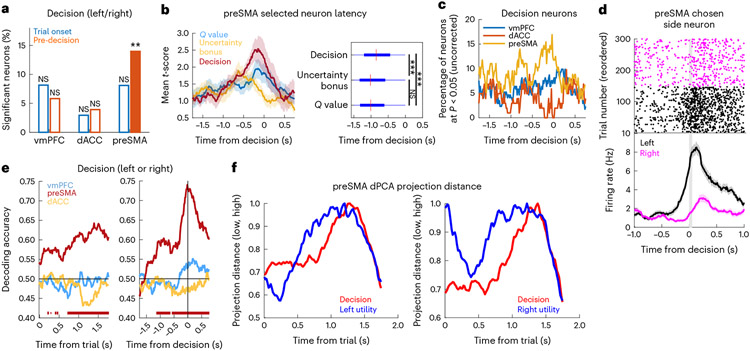
Fig. 4 ∣. The PreSMA encodes decisions.
a, Percentage of decision neurons (left versus right choice) in the vmPFC, dACC and preSMA at the trial onset (blue) and pre-decision (orange, preSMA: P = 0.002) periods (**P < 0.01, one-sided permutation test). The unfilled bars indicate non-significant counts. b, Sensitive preSMA neuron timing during the pre-decision period. Left, mean absolute t-score for the value (blue, n = 21 neurons), uncertainty bonus (yellow, n = 14 neurons) and decision (red, n = 19 neurons). The shaded areas indicate the s.e.m. Right, latency time box plots for all -value, uncertainty bonus or decision neurons (***P < 0.001, two-sided Wilcoxon rank-sum test). P values are as follows: P < 0.001 for decision versus uncertainty bonus; P < 0.001 for decision versus . The red mark indicates the median and the box extends between the 25th and 75th centiles of latency times. The bar whiskers extend to the most extreme data points not labelled as outliers, defined as values that are more than 1.5 times the interquartile length away from the edges of the box. c, Percentage of significant decision neurons in the vmPFC (blue), dACC (orange) or preSMA (yellow). d, Example preSMA decision neuron. Top, raster plot. For plotting, we sorted trials into left (black) and right (magenta) decisions. Bottom, PSTH (bin size = 0.2 s, step size = 0.0625 s). The grey bar indicates the button press. Data are presented as mean values ± s.e.m. e, dPCA decision decoding for vmPFC (blue), preSMA (red) and dACC (yellow). The bars indicate significant times compared to a bootstrapped null distribution. The horizontal line indicates chance. Left, trial onset period. Right, pre-decision period. f, Normalized Euclidean distance between dPCA projections onto principal utility components (blue), between low- and high-utility trials and decision components (red) and between left and right decision trials, with left (left) or right (right) utility marginalizations.

