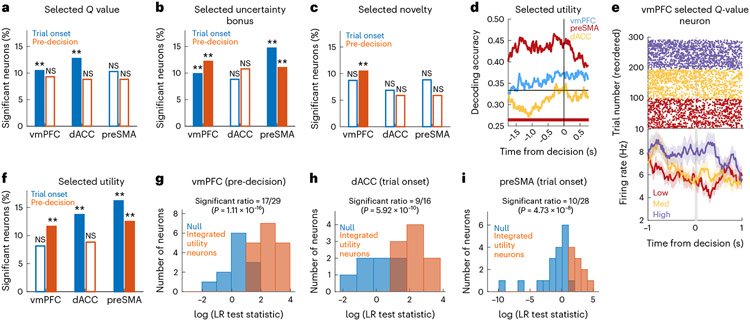
Fig. 5 ∣. Encoding selected stimulus properties.
a, Percentage of selected -value neurons in the vmPFC, dACC and preSMA at the trial onset (blue, P = 0.002 for the vmPFC and dACC) and pre-decision (orange) periods (**P < 0.01, one-sided permutation test). The unfilled bars indicate non-sensitive counts. b, Same but for selected uncertainty. P = 0.002 for the vmPFC and preSMA, both periods. c, Same but for selected novelty. P = 0.002 for the preSMA, pre-decision. d, dPCA selected utility decoding in the pre-decision period for the vmPFC (blue), preSMA (red) and dACC (yellow). The bars indicate significant decoding accuracies for each brain region, compared to a bootstrapped null distribution. e, Example selected -value neuron in the vmPFC. Top, raster plots. For plotting, we sorted trials by -value tertiles (purple: high; yellow: medium; red: low). Bottom, PSTH (bin size = 0.2 s, step size = 0.0625 s). The grey bar indicates the button press. Data are presented as mean values ± s.e.m. f, Same as in a but for selected utility. P = 0.002 for vmPFC, pre-decision, dACC, trial onset and preSMA, both periods. g, Histogram of LR test statistics across candidate vmPFC integrated selected utility neurons (orange) in the pre-decision period. For the remaining neurons (blue), a null model containing only selected values was not rejected. h, Same as in g but for dACC. i, Same as in g but for the preSMA.

