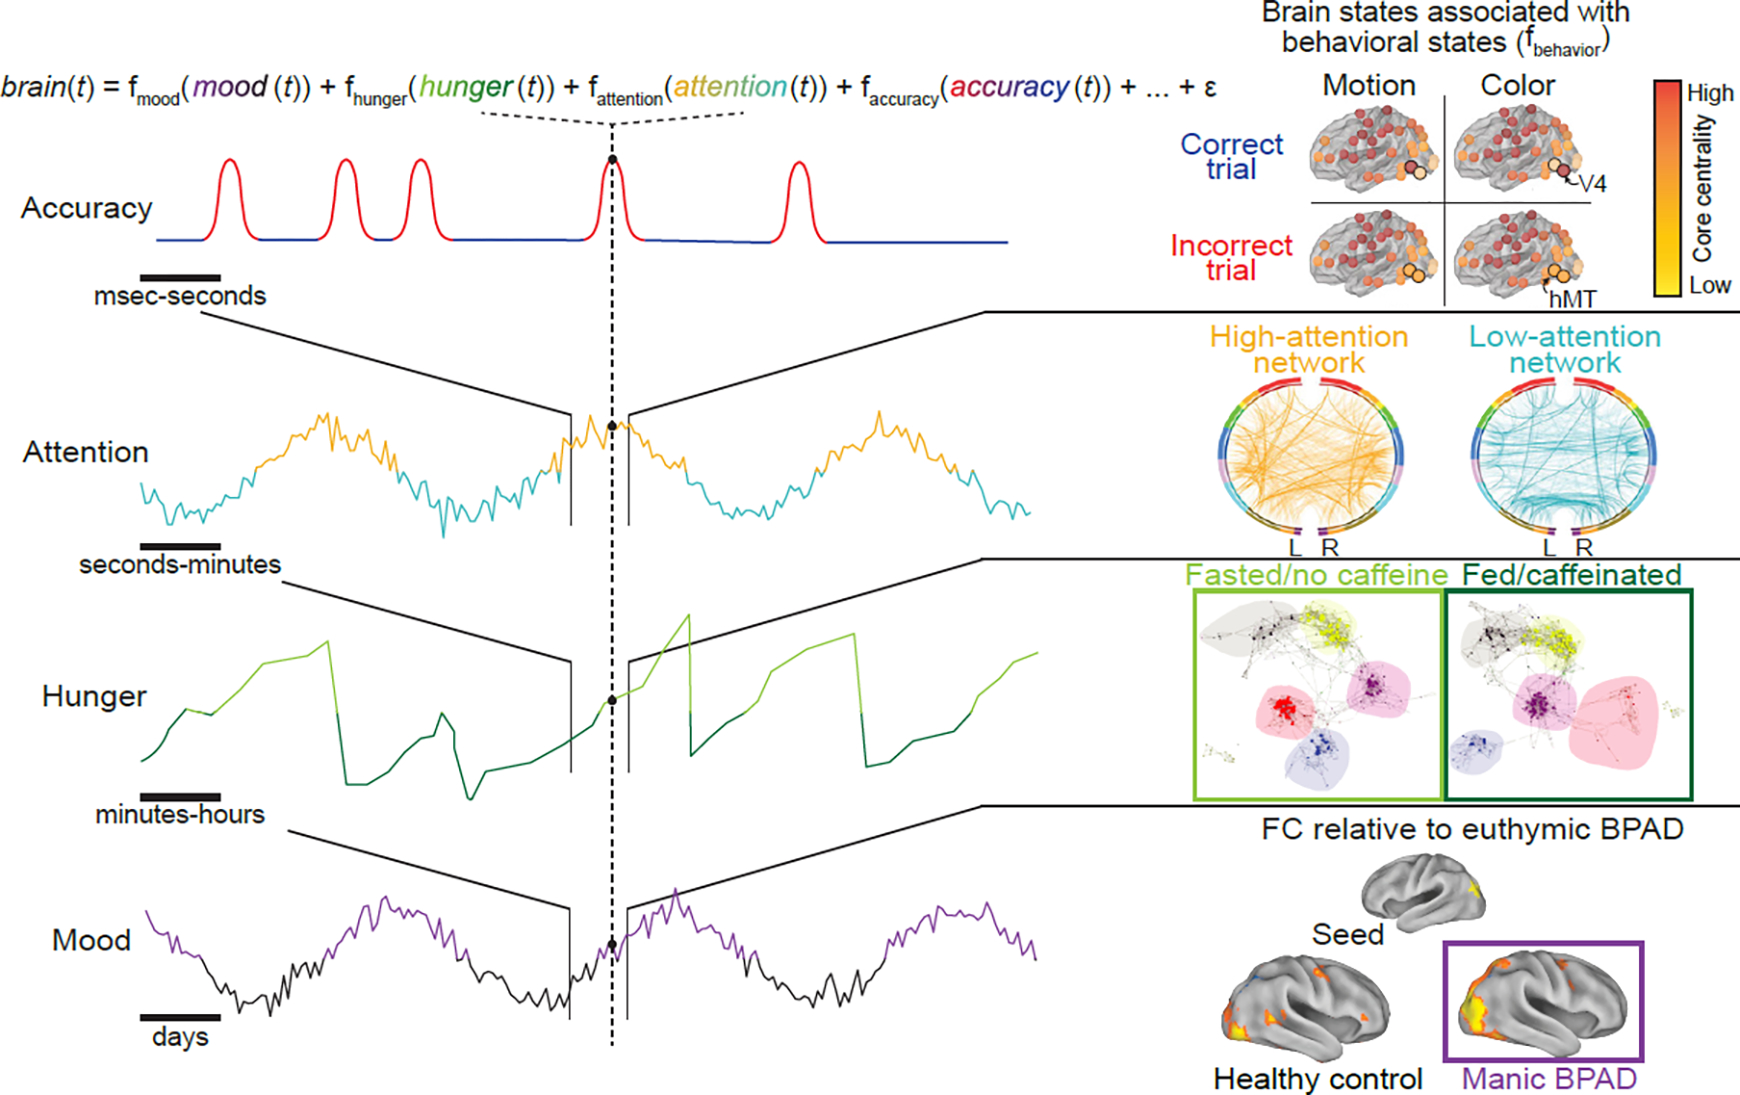
Figure 3. Behavioral states evolve at varied temporal scales and interact at each time point.

Left: four examples of behavioral (i.e., physiological and cognitive) state domains—mood, hunger, attention, and task performance—are depicted by simulated time courses. Each behavioral state unfolds on a different temporal scale, and brain activity at each moment in time reflects the combination of the behavioral states occurring and interacting at that time and the brain states underlying them. Right: examples of previous work studying patterns of brain activity (brain states) that correspond to each of these physiological and cognitive states in isolation. Top: Network reconfiguration tracks task performance, such that core centrality of task-relevant regions (area V4 on color discrimination trials and area hMT on motion discrimination trials) increases during preparation for trials on which participants respond correctly. Schematized depiction of results from[85]. Second from top: Functional connectivity patterns that predict low and high attention across two, independent datasets. Colored bars represent “lobes” (e.g., blue, temporal). Adapted from[86]. Second from bottom: Changes in whole-brain network organization, as measured using fMRI-based functional connectivity, in fed and fasted states. Each point represents a brain region, colored by network assignment (e.g., blue, visual network), with hub regions enlarged. Adapted from[157]. Bottom: differences in seed-based functional connectivity (FC) between bipolar mania and bipolar euthymia, and between healthy control and bipolar euthymia. Adapted from[158]. BPAD, bipolar affective disorder.
