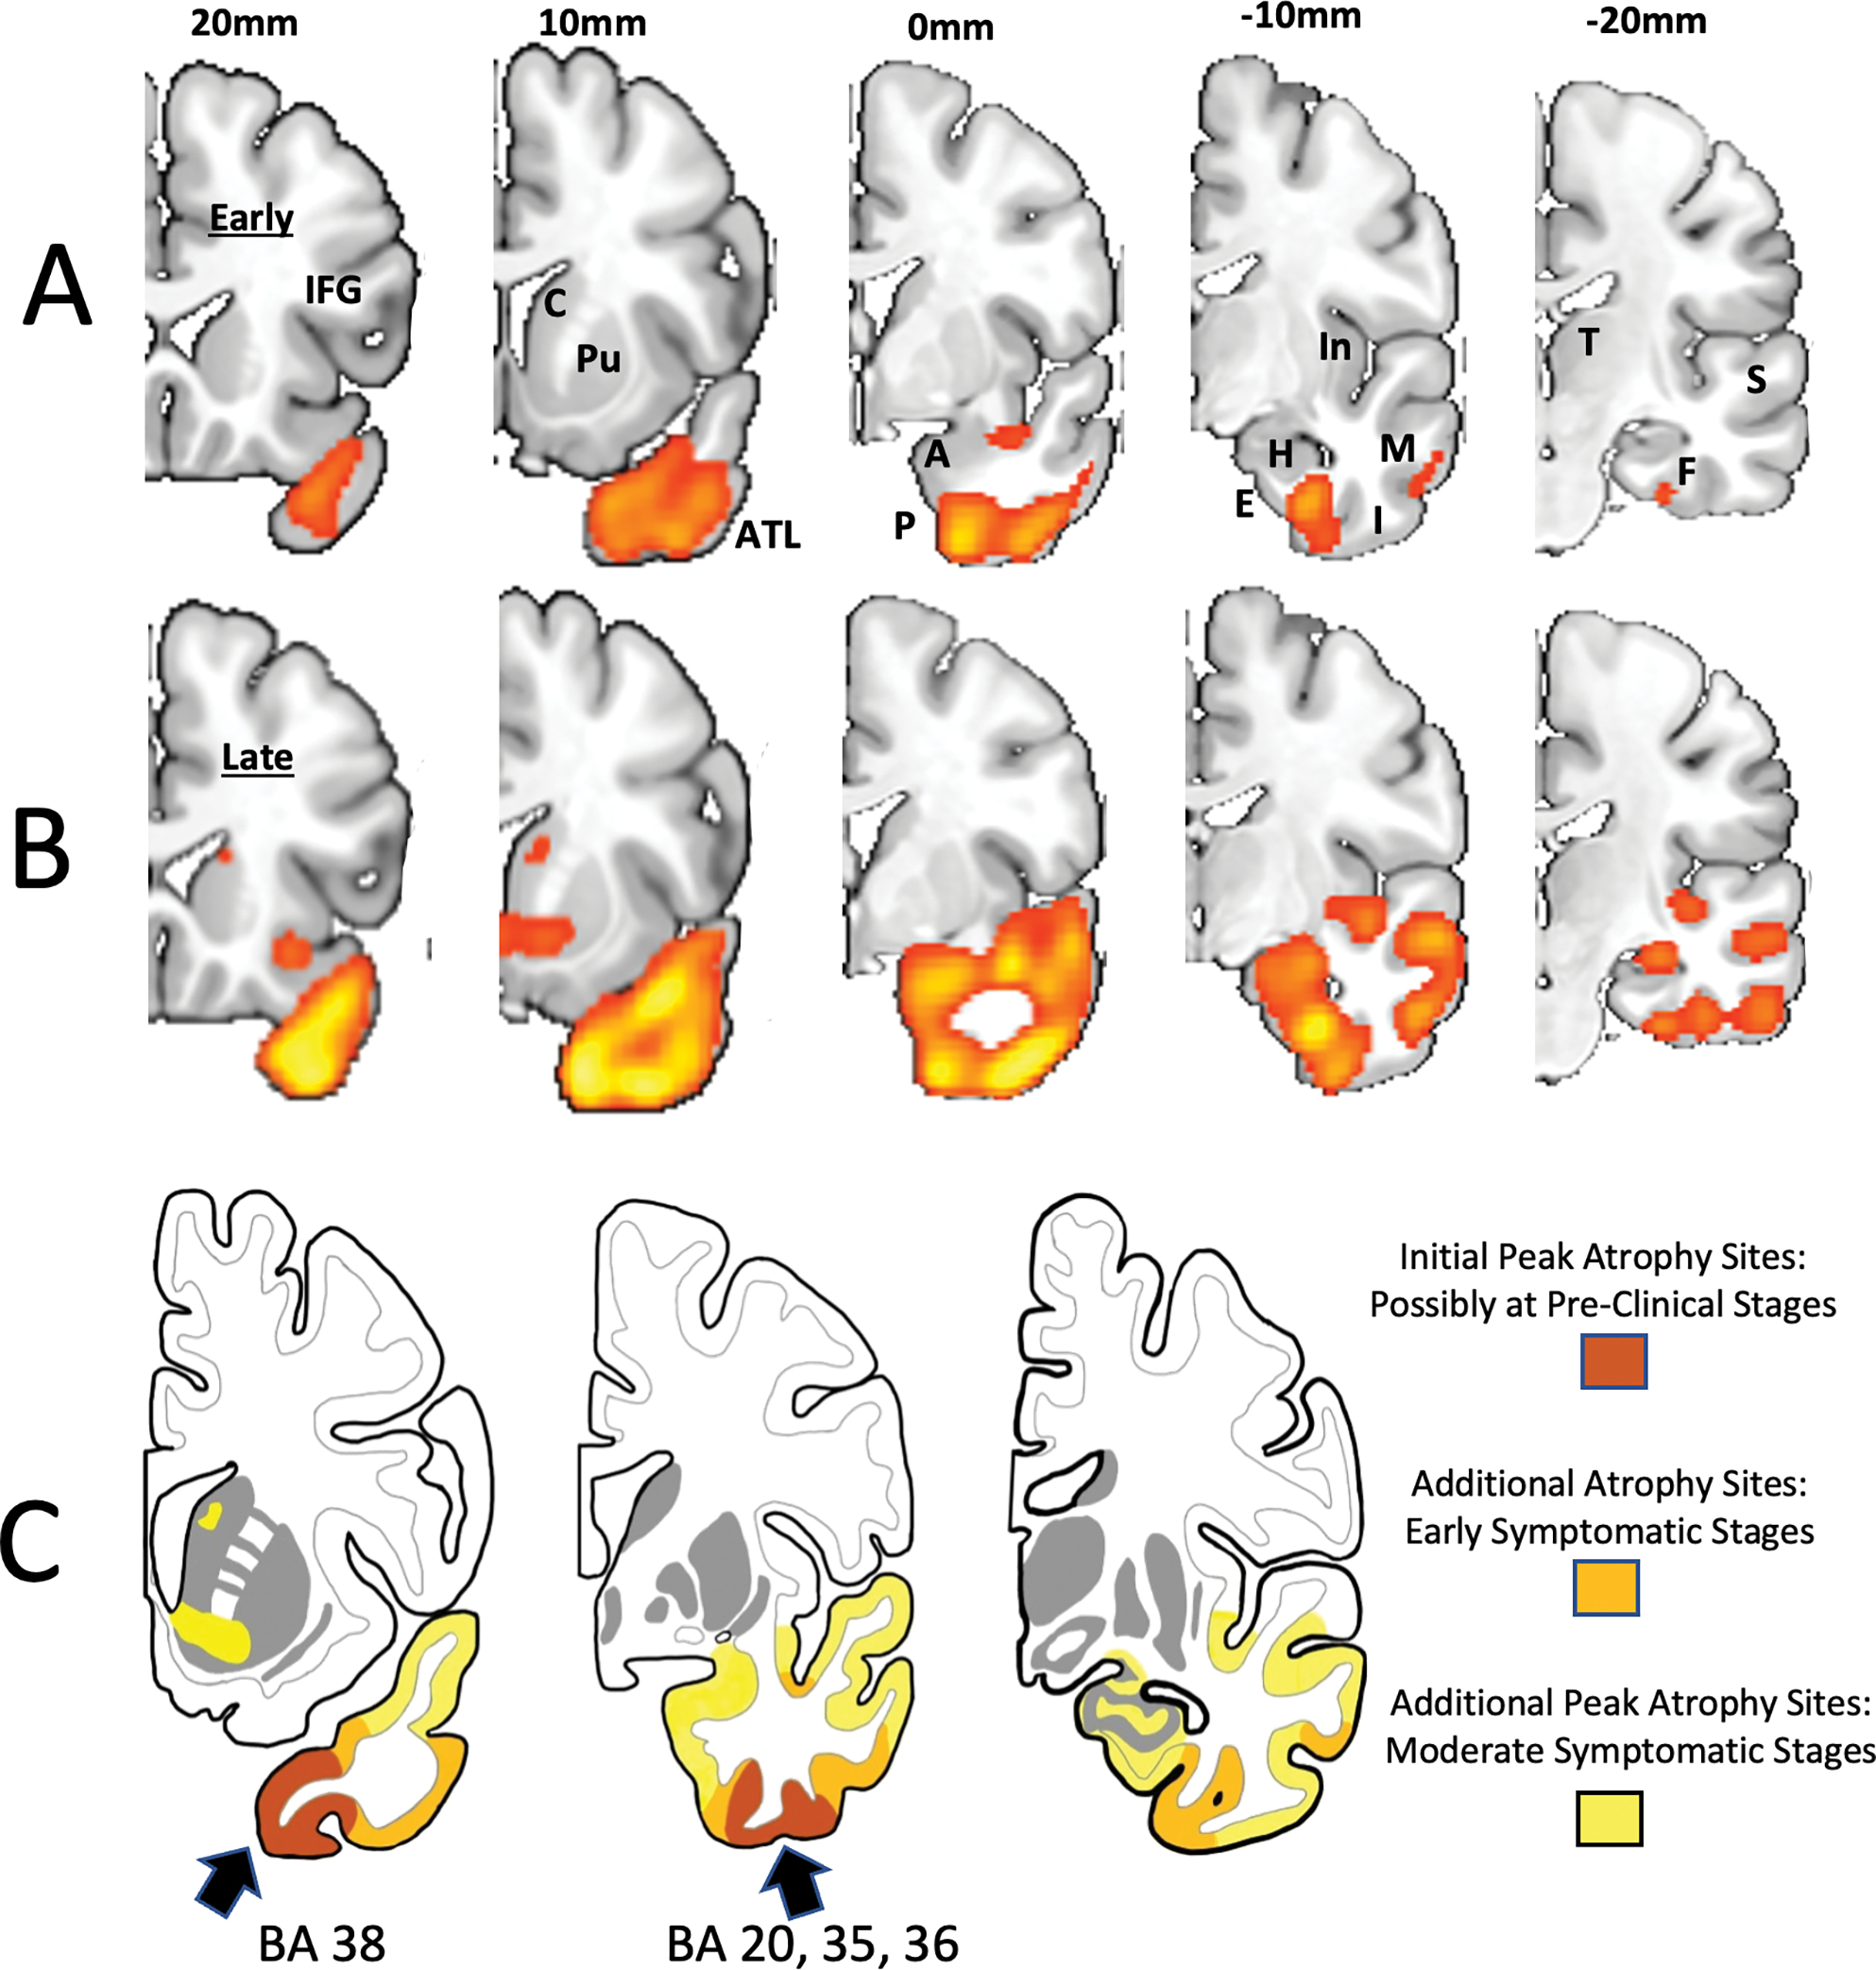
Figure 2. Progression of Gyral and Sulcal Peak Atrophy Sites Shown by Voxel Based Morphometry.

The colored patches on rows A and B indicate areas of cortical volume loss in comparison to a control group at a statistical significance of p<.001 and minimum cluster size of 100 voxels. These are peak atrophy sites. The presence of additional atrophy that fails to reach statistical significance cannot be ruled out. From left to right, each row represents increasingly more caudal coronal sections from the same hemisphere. The mm designations refer to the distance from the anterior commissure (AC) in millimeters, positive numbers indicating locations in front of the AC. A. and B. Left hemisphere of a semantic PPA patient initially seen at an earlier stage of clinical severity than the patient in Figure 1. Images were obtained at an interval of 4 years and represent early (A) and moderate (B) symptomatic stages of neurodegeneration. C. Composite illustration of progressive atrophy. The stage of ‘initial a peak trophy’ is inferred based on emergent right ATL atrophy in PPA patients who had no such atrophy at prior imaging. The progression illustrated in C is approximated to occur over a span of 6–8 years from symptom onset and is based on the examination of 56 hemispheres of the 28 patients with TDP-C, many with longitudinal imaging. The arrows point to the Brodmann areas where initial peak atrophy emerges in our collection of cases. Abbreviations: A- amygdala; AC- anterior commissure; ATL- anterior temporal lobe; BA- Brodmann area; C- caudate; E- entorhinal cortex; F- fusiform gyrus; H- hippocampus; I- inferior temporal gyrus; IFG- inferior frontal gyrus (Broca’s); In- insula; M- middle temporal gyrus; P- perirhinal area; Pu- putamen; S- superior temporal gyrus; T- thalamus.
