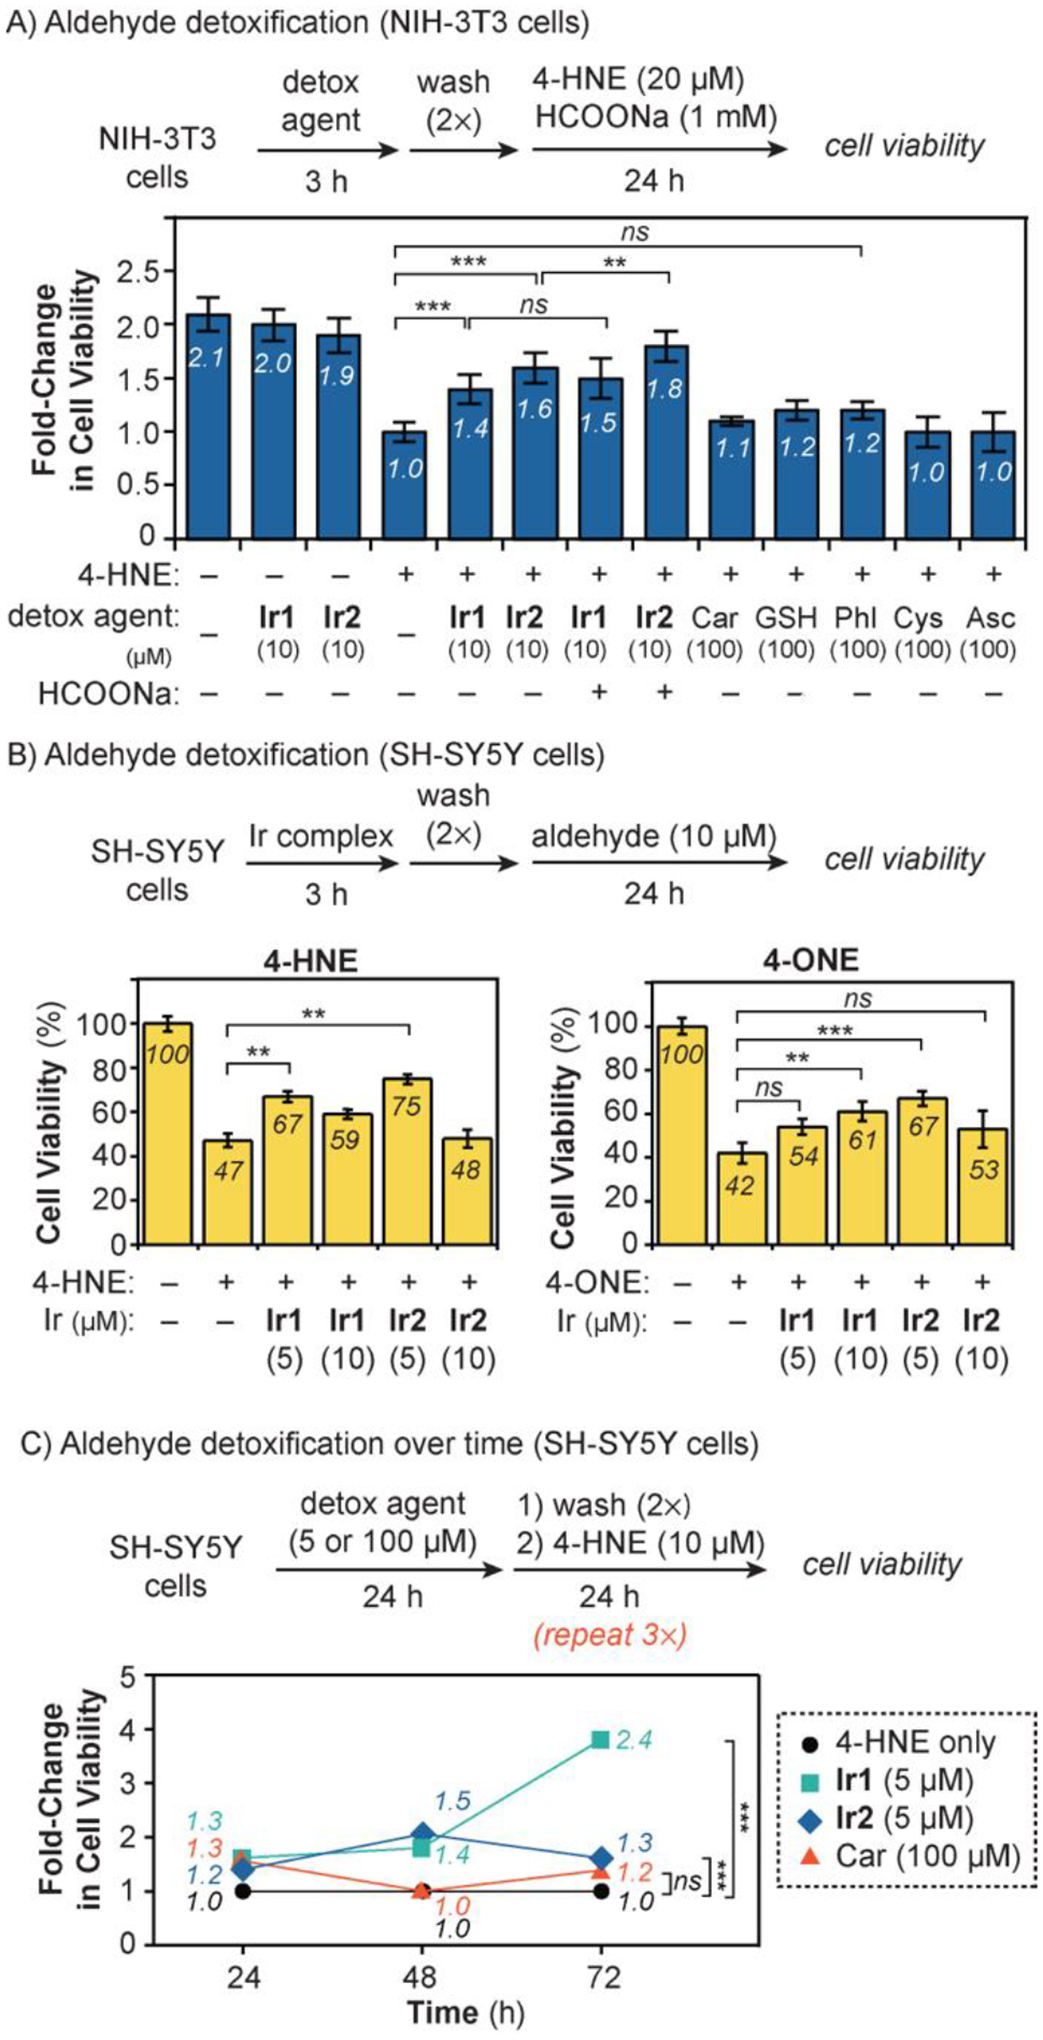
Figure 3.

Aldehyde detoxification studies in A) NIH-3T3 with 4-HNE; B) SH-SY5Y with 4-HNE and 4-ONE; and C) SH-SY5Y with consecutive treatments of 4-HNE. The fold change in cell viability was calculated as the ratio of the percentage of viable cells in treated wells divided by the percentage of viable cells in control wells containing only 4-HNE. The data were analyzed using one-way ANOVA. The p-values are indicated as follows: ns = p > 0.05, * = p < 0.05, ** = p < 0.01; and *** = p < 0.001. The error bars in part C were omitted for clarity but are shown in Figures S21 and S23.
