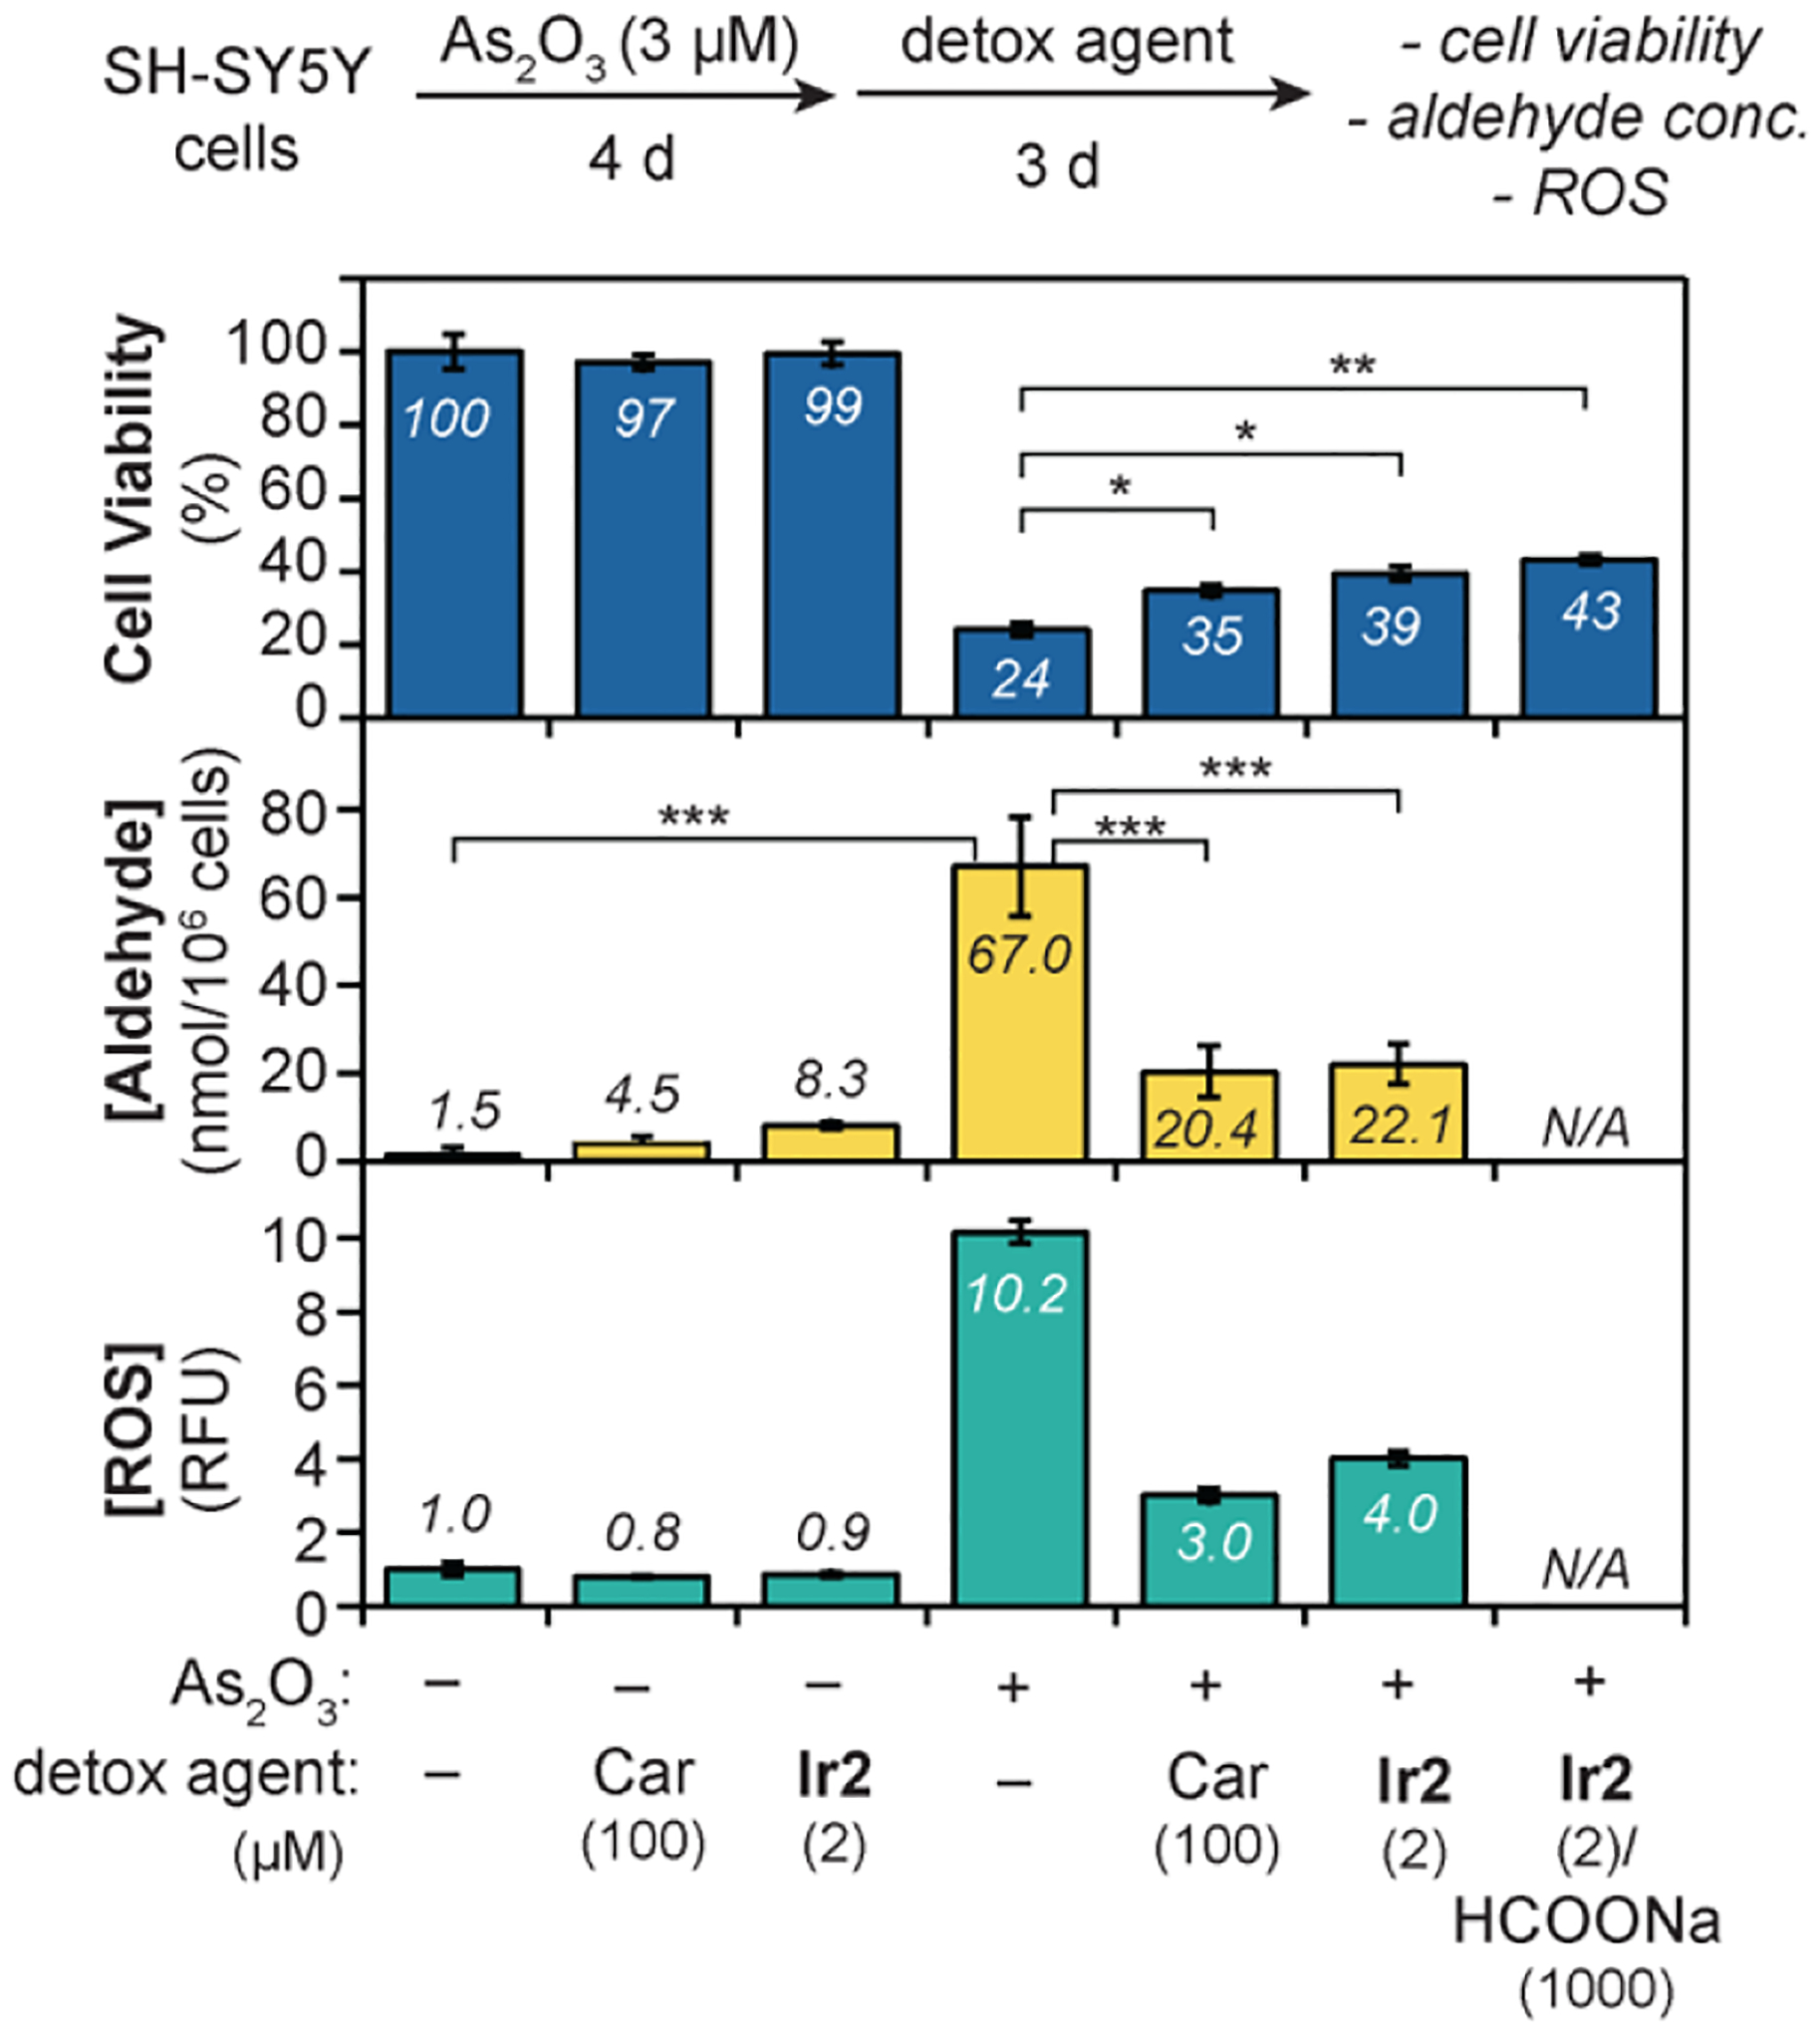
Figure 4.

Effect of detox agents on the cell viability, aldehyde concentration, and reactive oxygen species after treatment with As2O3. The data were analyzed using one-way ANOVA. The p-values are indicated as follows: ns = p > 0.05, * = p < 0.05, ** = p < 0.01; and *** = p < 0.001. N/A = not available.
