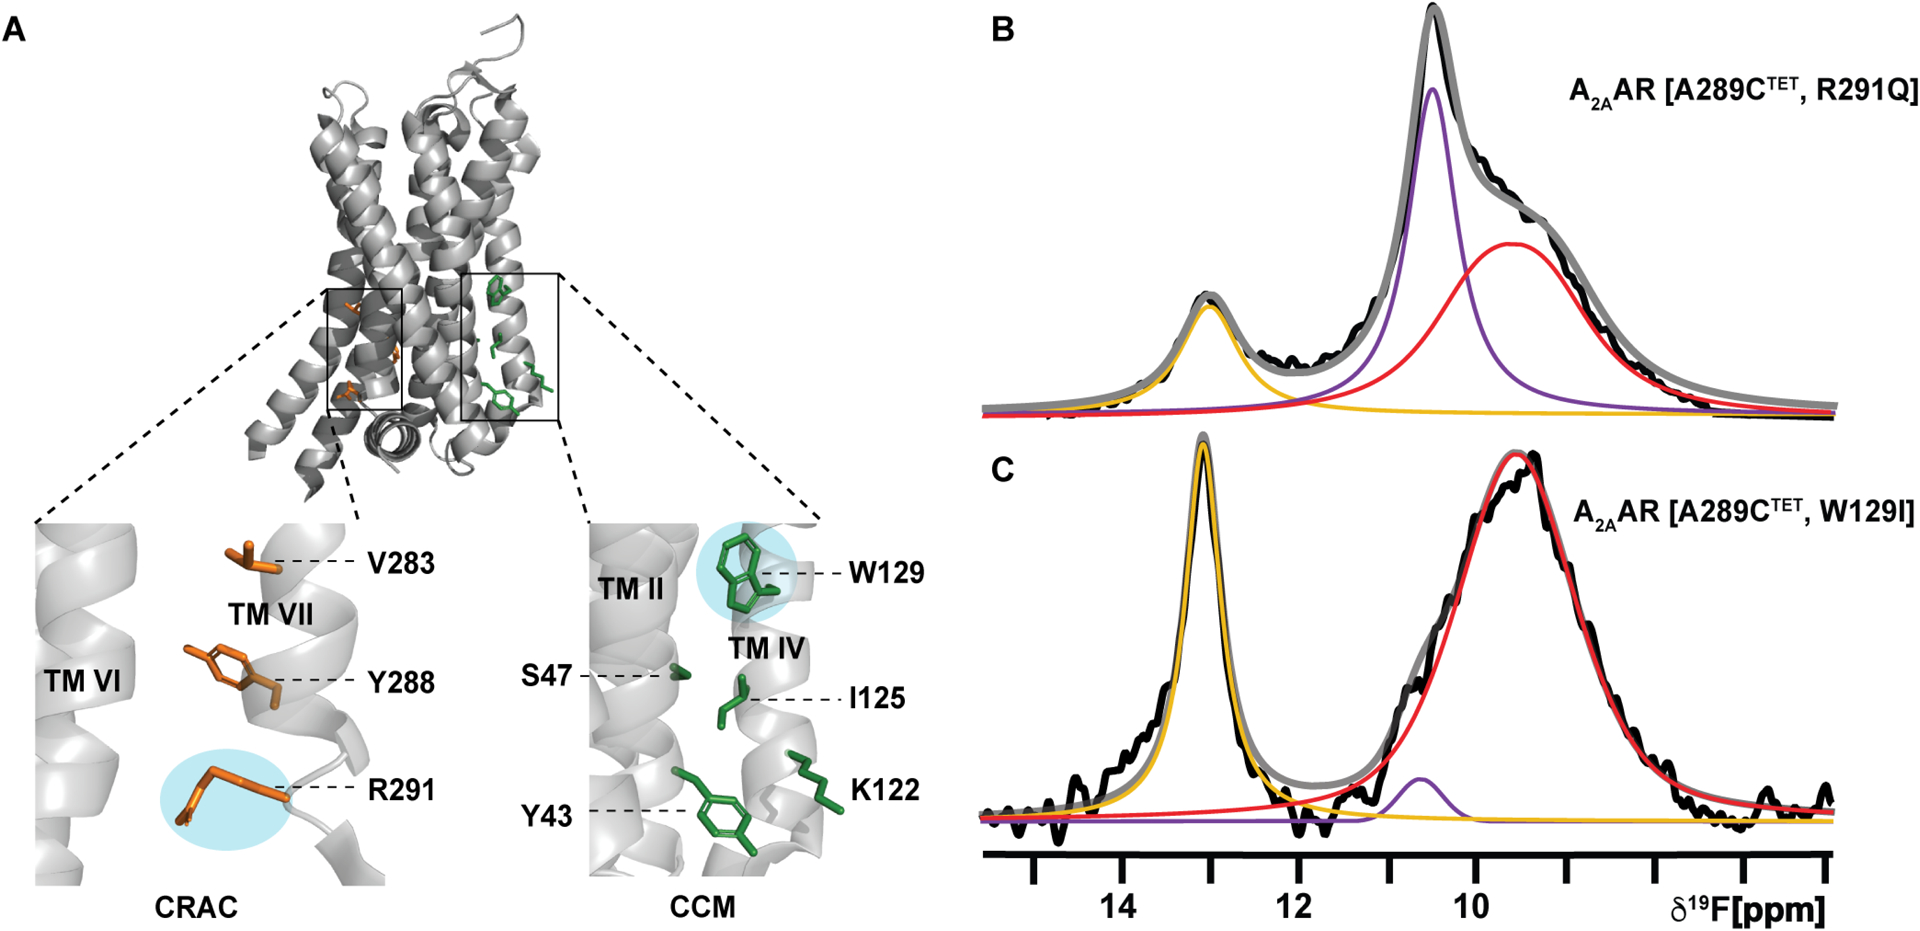
Figure 5. Impact of cholesterol interaction sites on the conformational dynamics of A2AAR.

(A) Crystal structure of A2AAR (PDB: 5G53) showing the predicted CRAC site62 (orange) and CCM site74 (green). Expanded insets show the individual residues of each motif predicted to interact with cholesterol. Residues shown in cyan ellipses were mutated for 19F NMR analysis.
(B and C) 1-dimesional 19F NMR spectra of A2AAR variants in complexes with the agonist NECA and in nanodiscs containing POPC and 0.5 mol% cholesterol for (B) A2AAR[A289CTET, R291Q], and (C) A2AAR[A289CTET, W129I]. Other presentation details are the same as in Figure 2. See also Table S4.
