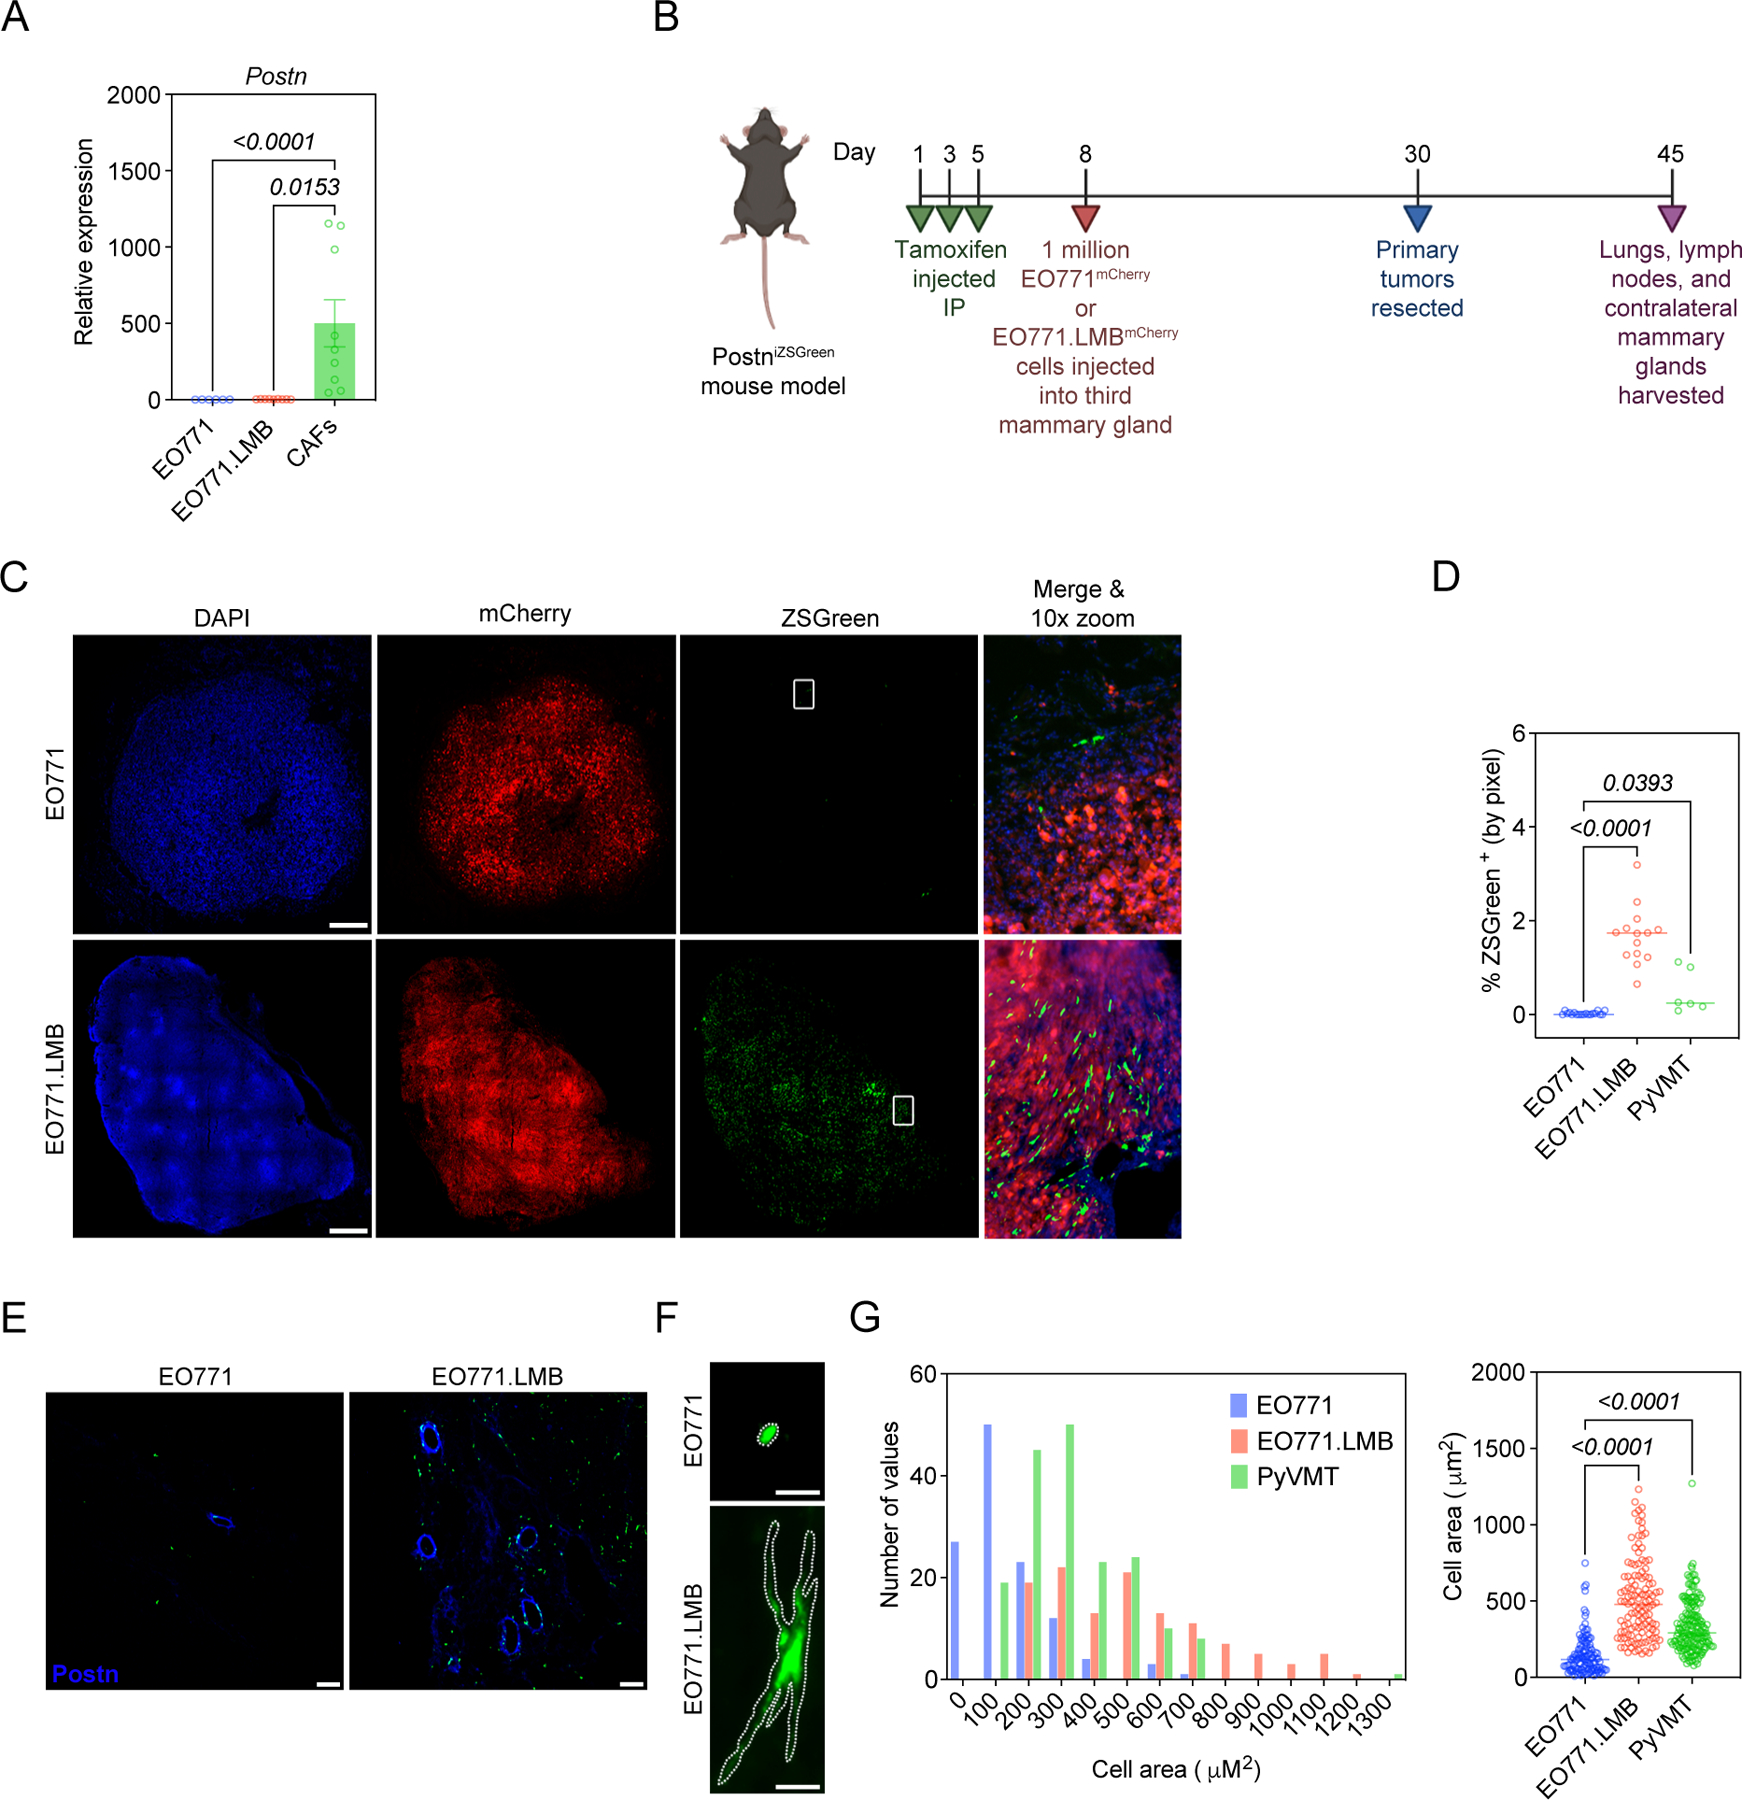
Figure 3. Highly-metastatic mammary tumors differentially activate periostin-expressing CAFs.

(A) qPCR analysis of periostin expression in mammary tumor cell lines and murine mammary CAFs. Data represent the mean ± SEM. Experiments were performed in triplicate and results compared using Kruskal-Wallis test. (B) Study design for EO771 vs EO771.LMB experiment in PostniZSGreen lineage tracing mice. (C) Tissue tilescans of primary mammary tumors from PostniZSGreen mice. Tumor cells labelled with mCherry and periostin-expressing cells genetically labelled with ZSGreen. Nuclei counterstained with DAPI. Scale bars: 500 μm. (D) Percentage of tissue area positive for ZSGreen in low-metastatic (EO771) tumors versus highly-metastatic (EO771.LMB and PyVMT) tumors (n = 3–7 mice per group). Each data point represents a histological section. Statistics shown for Kruskal-Wallis, Dunn’s multiple comparisons test. (E) Representative immunofluorescence images of mammary tumors from PostniZSGreen mice stained for periostin (in blue), with periostin-expressing cells genetically labelled with ZSGreen. Scale bars: 100 μm. (F) Representative images of individual ZSGreen-labelled periostin-expressing cells in EO771 and EO771.LMB tumors. Scale bars: 10 μm. (G) Area of individual ZSGreen-labelled cells in primary tumors represented as a histogram (left) and scatter plot (right). Each data point in the scatter plot represents an individual cell. 120–180 cells were measured from multiple tumor sections (n = 3–6 mice per group) and results compared using Kruskal-Wallis, Dunn’s multiple comparisons test. (Study design schematic created using BioRender.com).
