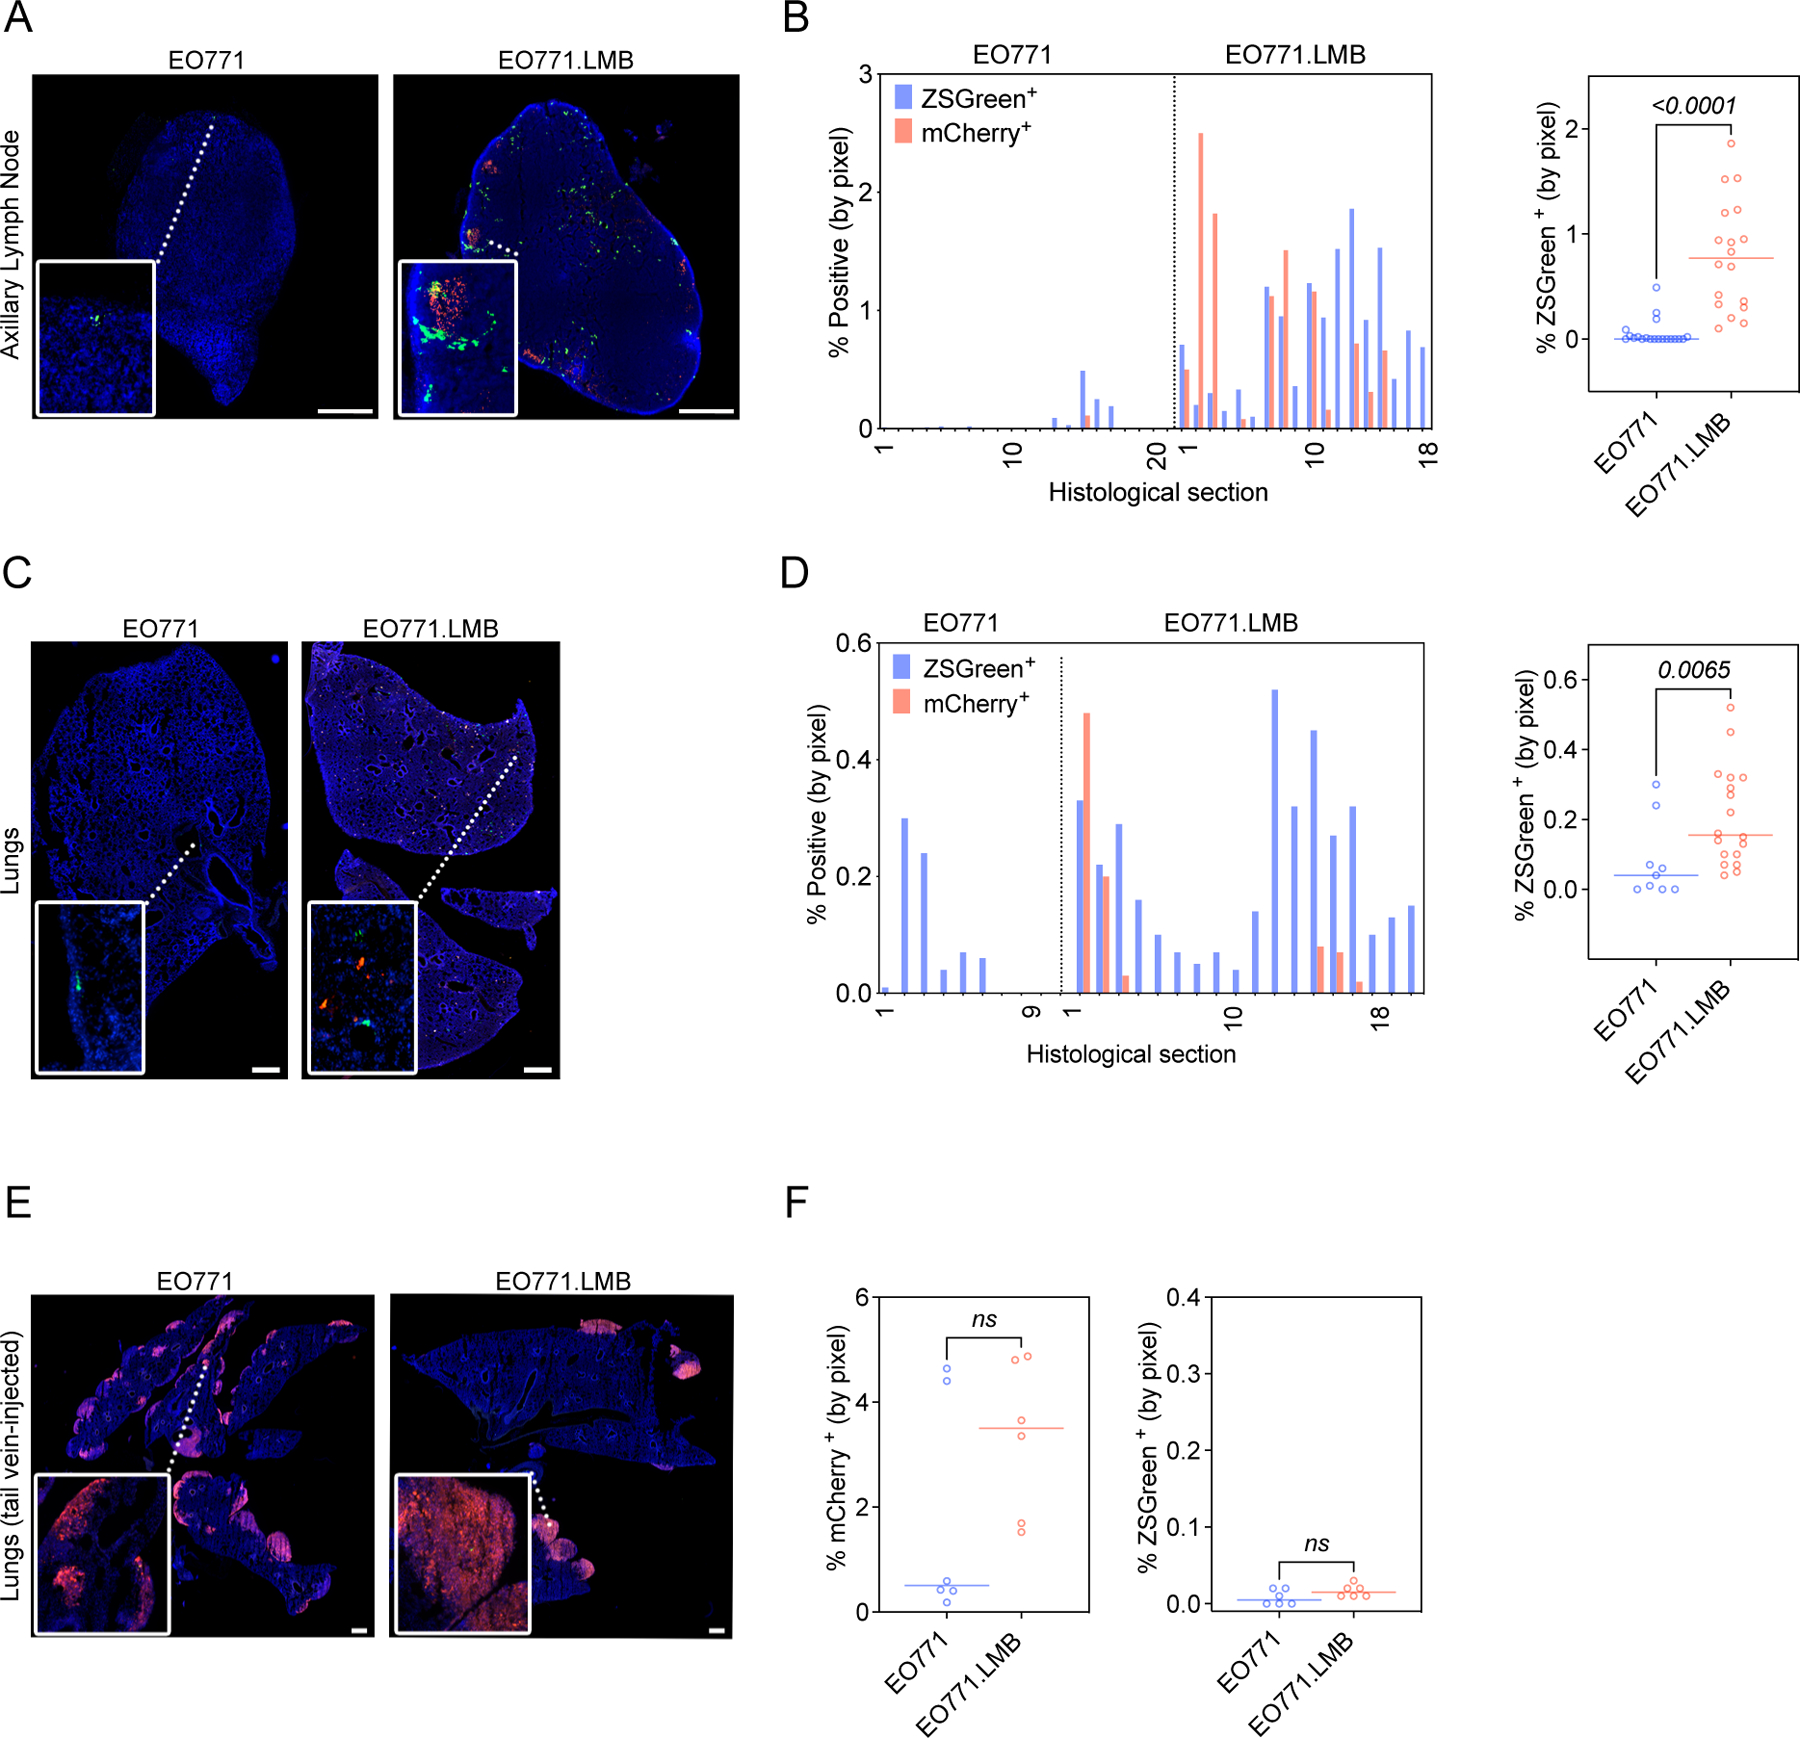
Figure 4. Periostin-expressing CAFs are more abundant in the metastatic niches of mice bearing highly-metastatic mammary tumors.

(A)Tissue tilescans of axillary lymph nodes from PostniZSGreen mice bearing low-metastatic (EO771) or highly-metastatic (EO771.LMB) mammary tumors. Tumor cells labelled with mCherry and periostin-expressing cells genetically labelled with ZSGreen. Nuclei counterstained with DAPI. Scale bars: 500 μm, insets: 3x zoom. (B) Percentage of tissue area positive for ZSGreen in serial sections of axillary lymph nodes from mice bearing EO771 or EO771.LMB mammary tumors represented as a histogram (left) and scatter plot (right). Each bar of the histogram represents a different histological section with matched mCherry and ZSGreen measurements. The scatter plot shows individual ZSGreen measurements with each point representing a different histological section (n = 6–7 lymph nodes per group). Statistics shown for Mann-Whitney test. (C) Tissue tilescans of lungs from PostniZSGreen mice bearing low-metastatic (EO771) or highly-metastatic (EO771.LMB) mammary tumors. Tumor cells labelled with mCherry and periostin-expressing cells genetically labelled with ZSGreen. Nuclei counterstained with DAPI. Scale bars: 500 μm, insets: 6x zoom. (D) Percentage of tissue area positive for ZSGreen in serial sections of lungs from mice bearing EO771 or EO771.LMB mammary tumors represented as a histogram (left) and scatter plot (right). Each bar of the histogram represents a different histological section with matched mCherry and ZSGreen measurements. The scatter plot shows individual ZSGreen measurements with each point representing a different histological section (n = 3–6 lungs per group). Statistics shown for Mann-Whitney test. (E) Tissue tilescans of lungs from PostniZSGreen mice injected via tail vein with EO771 or EO771.LMB tumor cells. Tumor cells labelled with mCherry and periostin-expressing cells genetically labelled with ZSGreen. Nuclei counterstained with DAPI. Scale bars: 500 μm, insets: 6x zoom. (F) Percentage of tissue area positive for mCherry (left) and ZSGreen (right) in serial sections of lungs from tail vein-injected mice. Each data point represents a different histological section (n = 3 mice per group). Statistics shown for Mann-Whitney test.
