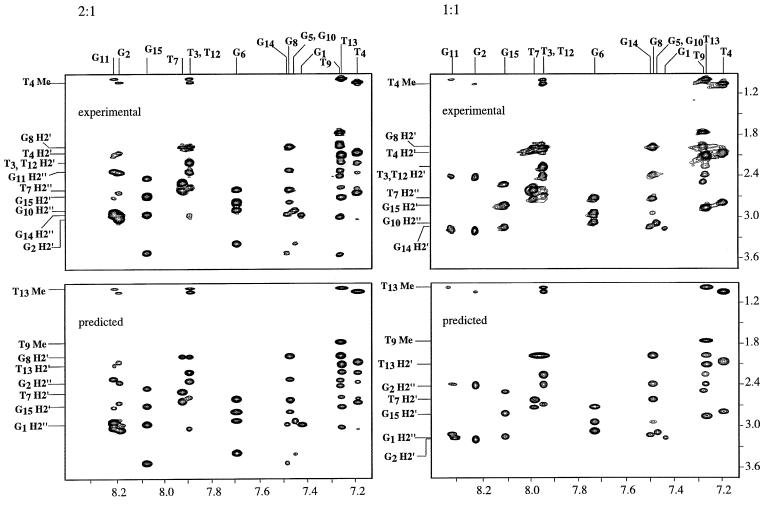
Figure 4.
A region of the 250 ms mixing time, 500 MHz NOESY spectra of the 15mer is shown. The region shown contains the aromatic-H2′, H2″, methyl connectivities. The top left contains the experimental data for the 2:1 complex and the bottom left the same spectral region predicted from the 10 structures obtained in the restrained molecular dynamics trajectory. The spectra were backcalculated from each of the 10 structures and averaged. The top right contains the experimental data for the 1:1 complex and the bottom left the same spectral region predicted from the 10 structures obtained in the restrained molecular dynamics trajectory.

