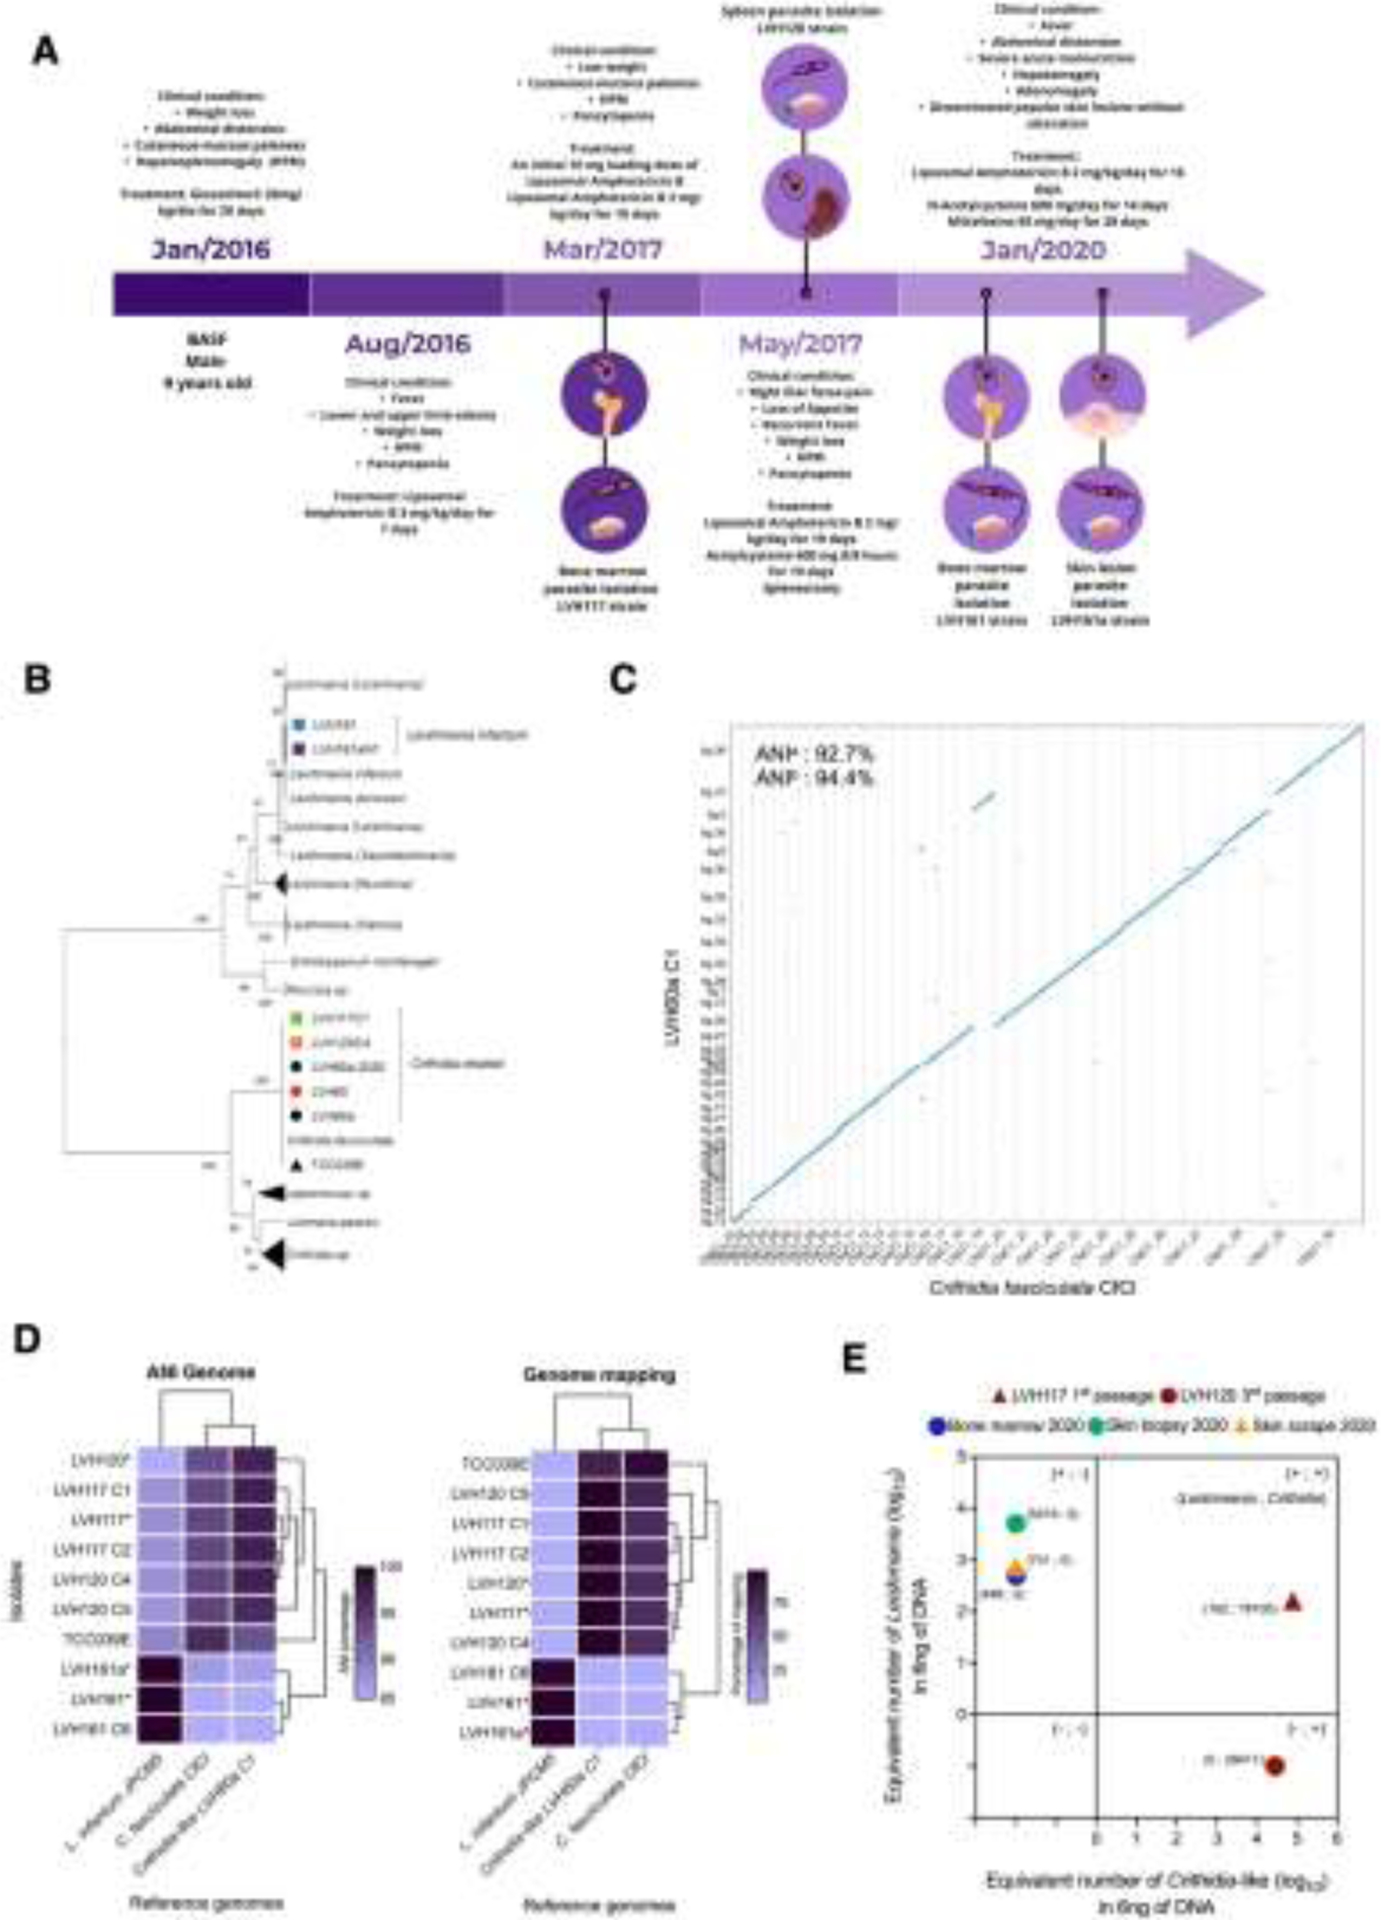
Figure 1.

VL case report analysis. (A) Timeline of the patient’s admissions depicting parasite isolations. (B) Phylogenomic analysis of Leishmaniinae parasites. Clinical isolates are highlighted with coloured icons. (C) Nucmer dot plot displaying the whole-genome alignment of chromosome between LVH60a-C1 Crithidia-like and C. fasciculata-CfCl. ANI: average nucleotide identity. (D) Clustered heatmaps showing the percentage of ANI and read mapping values for the genomes of clinical isolates against reference genomes. (E) qPCR-based detection of parasites in parasite cultures and patient tissue samples.
