

Abstract
The glycoprotein spikes of membrane-enveloped viruses include a subunit that catalyzes fusion (joining) of the viral and target cell membranes. For influenza virus, this is subunit 2 of hemagglutinin which has a ~20-residue N-terminal fusion peptide (Fp) region that binds target membrane. An outstanding question is whether there are associated membrane changes important for fusion. Several computational studies have found increased “protrusion” of lipid acyl chains near Fp, i.e. one or more chain carbons are closer to the aqueous region than the headgroup phosphorus. Protrusion may accelerate initial joining of outer leaflets of the two membranes into a stalk intermediate. In this study, higher protrusion probability in membrane with vs. without Fp is convincingly detected by larger Mn2+-associated increases in chain 13C NMR transverse relaxation rates (Γ2’s). Data analysis provides a ratio Γ2,neighbor/Γ2,distant for lipids neighboring vs. more distant from the Fp. The calculated ratio depends on the number of Fp-neighboring lipids and the experimentally-derived range of 4 to 24 matches the range of increased protrusion probabilities from different simulations. For samples either with or without Fp, the Γ2 values are well-fitted by an exponential decay as the 13C site moves closer to the chain terminus. The decays correlate with free-energy of protrusion proportional to the number of protruded -CH2 groups, with free energy per -CH2 of ~0.25 kBT. The NMR data support one major fusion role of the Fp to be much greater protrusion of lipid chains, with highest protrusion probability for chain regions closest to the headgroups.
Keywords: influenza, hemagglutinin, fusion peptide, NMR, PRE, protrusion
Introduction
Many zoonotic diseases including AIDS, influenza, and COVID are caused by viral pathogens that are membrane-enveloped.1–5 An initial step in cellular infection is fusion (joining) of the viral and target cell membranes with consequent deposition of the viral capsid in the cytoplasm. Enveloped viruses have glycoprotein spikes whose protein have a receptor-binding subunit (RbSu) followed by a fusion subunit (FsSu), with typical proteolytic cleavage between the two subunits.1,6–10 The FsSu has a single transmembrane domain and a large N-terminal ectodomain (Ed) outside the virus membrane. Each spike contains a core with a defined number (often 3) of non-covalently-associated Ed’s of FsSu’s, and the same number of RbSu’s that are non-covalently bound with this core. After the virus is in the host, RbSu’s bind to specific receptor molecules on the exterior of target cells, and for some viruses, there is subsequent endocytosis. The RbSu’s move away from the FsSu Ed core, and the core changes to a new structure, typically a thermostable trimer-of-hairpins with Tm > 90 °C.11–15 There isn’t sequence homology among the RbSu’s of different virus families which can be partly understood because the RbSu’s of different virus families bind different molecules. More surprisingly, there also isn’t sequence homology or sequence-length homology among the FsSu’s of different virus families. As noted above, the final Ed structure is typically a hairpin, but there are substantial length and structural differences between the hairpins of different families.16–20
There are also large geometric changes of the membranes during fusion, including intermediate structures, but there aren’t yet clear experimental data about the relative timings of changes in membrane vs. FsSu Ed structure. Fig. 1 displays a common model for the membrane changes. These changes are in time-sequence: (a) initial close (nm) apposition of the viral and target membranes; (b) stalk intermediate that connects and is contiguous with the outer leaflets of the two membranes; (c) hemifusion diaphragm with contiguous inner leaflets of the two membranes; (d) pore formation in the diaphragm; and (e) pore expansion with final state of contiguous membranes and viral contents in the cytoplasm.4,21,22 There are some experimental data that support this model as well as computational studies. The computational consensus estimates for energy barriers of uncatalyzed fusion are ~25 kcal/mole for step a and ~10 kcal/mole between the step a→b, b→c, and c→d states.4
Figure 1.
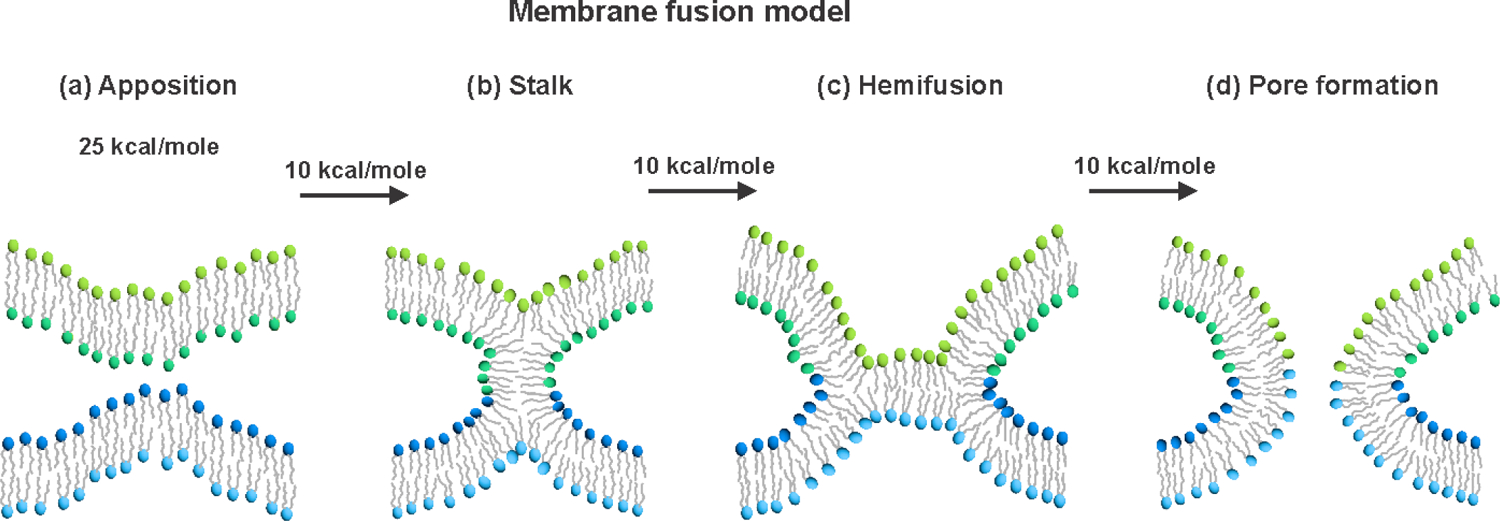
Pictorial representation of a common membrane fusion model that includes (a) initial close apposition of the viral and target membranes; (b) stalk formed from the outer leaflets of the two membranes; (c) hemifusion diaphragm that is contiguous with the inner leaflets of the two membranes; and (d) pore formation. The estimates of the free energy barriers for membrane apposition and for transformation between membrane intermediates are from computational studies of uncatalyzed fusion. The figure doesn’t show the final step of pore expansion that precedes full contents mixing. The different colors of the headgroups are meant to visually enhance the changes in membrane topology during fusion but don’t describe the locations of specific lipids during fusion. During the ~20 s estimated lifetime of a membrane intermediate structure in viral fusion, a lipid molecule could diffuse over ~1010 Å2 leaflet area.
FsSu’s have a N-terminal region (Ntr) that is not part of the final hairpin structure. The Ntr is often folded within the initial spike and then released as the hairpin forms.6–10 The Ntr length varies among FsSu’s from different viral families, and the range of lengths is typically between 30 and 250 residues. Within a Ntr, there are one or more proposed “fusion peptide” segments that are hypothesized to bind the target membrane during fusion.23–26 The membrane-bound fusion peptide(s) may reduce the 25 kcal/mole apposition barrier, in conjunction with the more C-terminal hairpin structure of the Ed and viral transmembrane domain. In addition, a membrane may be modified by fusion peptide so that there is also reduction in the 10 kcal/mole barriers between subsequent membrane intermediates.27–38 A fusion peptide segment has typically been identified by observation of mutations that reduce viral fusion and/or infection without affecting initial spike structure.15,24,39–44 In addition, a fusion peptide sequence is typically highly-conserved and should bind membrane.41,42,45,46
The present study is specifically focused on the fusion peptide (Fp) of the influenza virus FsSu which is subunit 2 of the hemagglutinin protein (Ha2). The influenza RbSu (Ha1) binds sialic acid followed by endocytosis of the virus and then endosome maturation that includes pH reduction to ~5.1 At low pH, Ha1 separates from the Ha2 Ed and the Ed then changes to the final trimer-of-hairpins structure with accompanying fusion between the viral and endosome membranes. The Ha2 Fp is the ~20 N-terminal and highly-conserved residues of Ha2. The Fp has been identified by: (1) significant attenuation of fusion when specific Fp residues are mutated; (2) very high sequence conservation among different influenza subtypes; and (3) observation of membrane-bound Fp after influenza virus fusion.15,23,40,44,46 The Ha2 Fp often adopts helical hairpin structure and is a mixture of: (i) closed structure in which the two antiparallel helices are in van der Waals contact; and (ii) semi-closed structure in which the Phe-9 sidechain is inserted between the two helices.47,48
The effects of the Ha2 Fp on membrane have been studied by computer simulations by several different groups. These simulations have typically been done using a membrane with Fp peptide without the rest of Ha2. One commonly-observed effect is a higher (~4–20×) probability for chain protrusion by lipids next to vs. further from the Fp (Fig. 2).49–51 Protrusion is specifically defined as one or more carbons of the lipid chain being at least 1 Å closer to the aqueous phase than the P nucleus of the lipid headgroup. Protrusion is a functionally-interesting motion. As depicted in Fig. 1, an early fusion step is the topological transition from (a) initial apposition of viral and target membranes to (b) stalk that connects the two membranes and is contiguous with the outer leaflets of these membranes. This step requires protrusion by some outer leaflet lipids of both membranes. The hypothesized correlation between increased lipid chain protrusion near Fp and stalk formation is supported by coarse-grained computer simulations of fusion that begin with full-length Ha2 with final trimer-of-hairpins structure and with Fp’s in one membrane and transmembrane domains in the other membrane.52 In the absence of Fp, simulations show that at any given time, ~1% of the lipids have a protruded chain.49–51 For simulations with Fp, ~ 4–20× increased protrusion probability is observed for both chains of a lipid that is Fp-adjacent and for a variety of Fp structures.49–51 Both interfacial and transmembrane locations of the Fp have been observed as well as a variety of geometries of the protruded lipid relative to the Fp. These include: (1) “straddling” of the protruded chain over the Fp; and (2) hydrogen bonding between the headgroup phosphate oxygen and one of the four N-terminal residues of the Fp with associated headgroup intrusion into the bilayer.49,50
Figure 2.
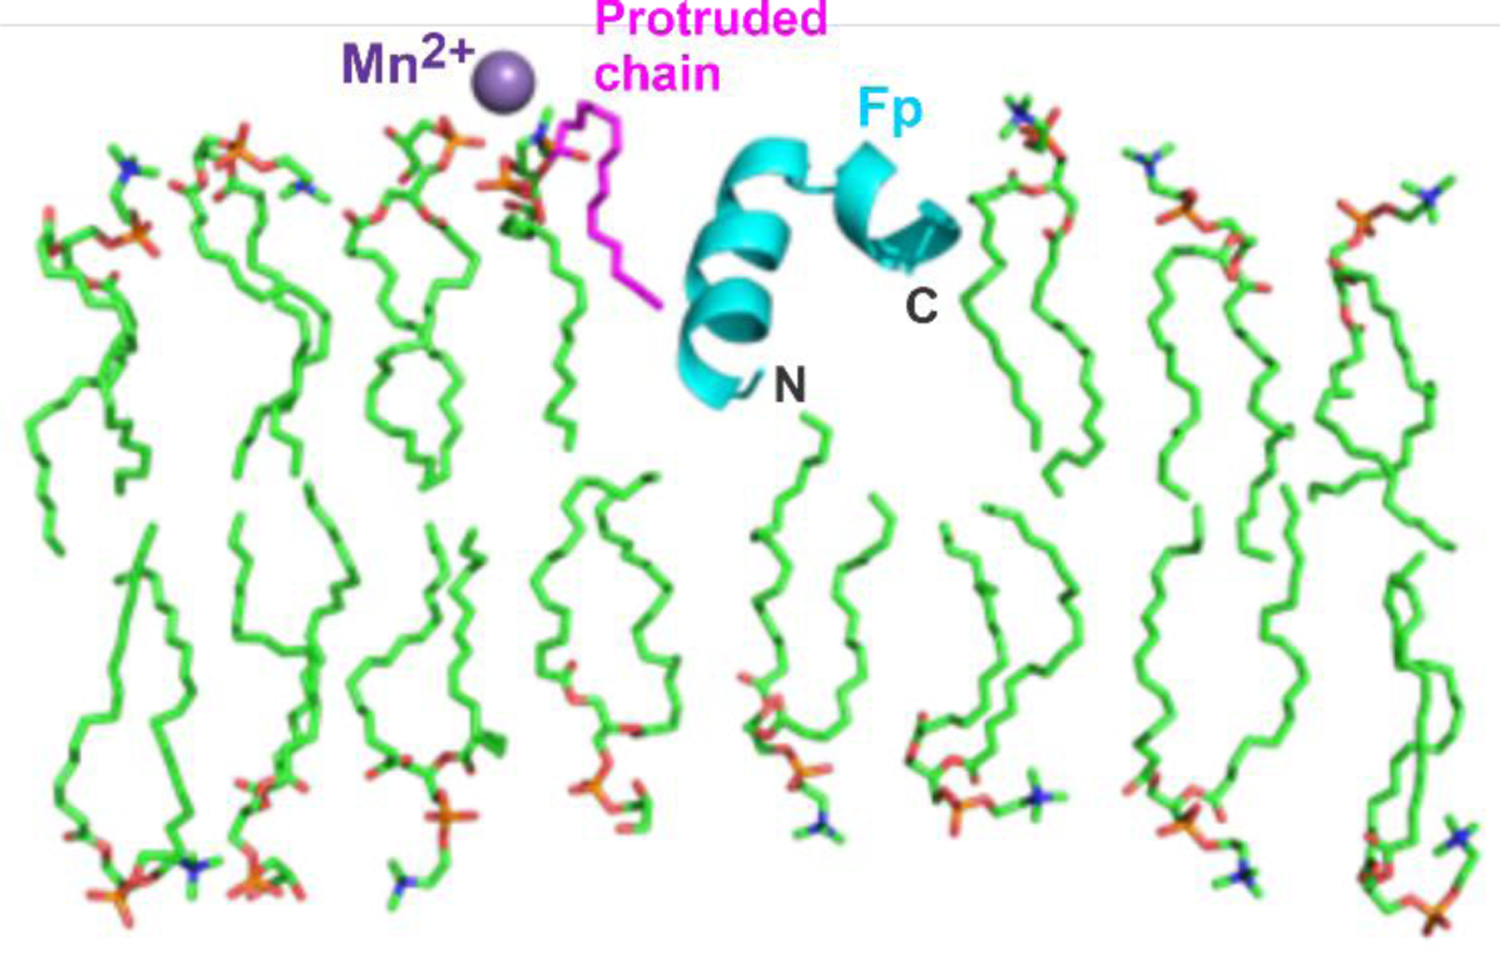
Representative picture of lipid acyl chain protrusion near a Fp. A set of 128 POPC and 32 POPG lipids in a pre-assembled bilayer were energy-minimized in a water box using the CHARMM/Membrane Builder/Bilayer Builder/Membrane Only System molecular dynamics program. A membrane cross-section is displayed with lipid acyl chains in light green. A representative protruded chain in magenta is next to a Fp backbone in turquoise and near a Mn2+ in purple that is bound to a lipid headgroup. The picture shows a protruded palmitoyl chain and a Fp with semi-closed structure with marked N- and C- termini. There is increased protrusion in simulations for both palmitoyl and oleoyl chains and for lipids next to a variety of Fp structures. In addition, Fp in simulations is observed with both interfacial and transmembrane locations and protruded lipids exhibit a variety of geometries relative to the neighboring Fp.
Despite its potential significance, to our knowledge there hasn’t yet been direct experimental observation of increased lipid protrusion for membrane with vs. without Fp. If chain protrusion is increased with Fp, there will be associated decreases in chain order parameters, and such decreases were observed and quantified in some of the computational simulations with membrane with Fp peptide.49,51 However, these computational predictions were contradicted by electron paramagnetic resonance (EPR) and fluorescence spectra that showed increases in chain order parameters for samples with Fp.28,33 Such increases were also observed for membrane with putative fusion peptides from other virus families.34–36 The sequences are non-homologous with the Ha2 Fp sequence. However, more recently, 2H nuclear magnetic resonance (NMR) spectra of membrane with perdeuterated lipids showed decreases in chain order parameters with vs. without Fp.37 The NMR-derived order parameters were in semi-quantitative agreement with the simulation-derived parameters.49,51,53 The seeming contradiction between EPR and NMR/simulation may be explained by: (i) EPR detects order for the spin labels and only 0.005 mole fraction of the sample lipids are spin-labeled, whereas (ii) NMR and simulation detect order for all lipids in the sample. The EPR-detected ordering of the spin label with Fp may be due to preferential binding of Fp to the spin label. This hypothesis is supported by the dose response of ordering with respect to Fp mole fraction. The ordering reaches its maximum value when the Fp:lipid mole ratio ≈ 0.002, which is similar to the spin-labeled lipid:total lipid mole ratio.
There is other indirect experimental support for increased lipid protrusion from analysis of the large increases in 2H NMR transverse relaxation rates (R2’s) of deuterated lipids in samples with vs. without Fp.38 The increases are interpreted to be due to modulation of the 2H NMR frequency as the lipid laterally diffuses in the membrane leaflet. For lipid next to vs. further from Fp, there are larger vs. smaller amplitudes of mean-squared 2H quadrupolar fields that are correlated with the smaller vs. larger chain order parameters. The experimental increases in R2’s with vs. without Fp are in semi-quantitative agreement with values calculated using experimentally-based estimates of order parameters and the time for a lipid to diffuse past a Fp. Both the decreases in chain 2H order parameters and large increases in 2H R2’s were also observed for a membrane sample with the putative fusion peptide of the HIV FsSu (gp41).38 The gp41 fusion peptide and the Ha2 Fp have non-homologous sequences and also adopt very different membrane-bound structures.54–58
Although these earlier experimental data are consistent with increased chain motion for lipid next to vs. further from Fp, they don’t directly evidence increased protrusion (Fig. 2). This knowledge gap motivated the present experimental NMR study in which chain protrusion is probed using comparison of chain 13C R2’s in samples with vs. without the paramagnetic Mn2+ species.59–61 The Mn2+ binds to the phosphate oxygens of the lipid headgroup, so a chain 13C R2 is augmented when the 13C site is protruded into the headgroup region. The change in protrusion probability with vs. without Fp is probed by the difference in Mn2+-associated increase in R2, i.e. paramagnetic relaxation enhancement (PRE). There is spectral resolution of some of the NMR signals from different −CH2 sites, so the approach also yields information about how Fp affects protrusion for −CH2 groups closer to the headgroup vs. the chain terminus.62
Materials and Methods
Lipids and Fp.
Fig. 3 displays the lipids 1-palmitoyl-2-oleoyl-glycero-3-phosphocholine (POPC) and1-palmitoyl-2-oleoyl-sn-glycero-3-phospho-(1’-rac-glycerol) (sodium salt) (POPG) that were purchased from Avanti Polar Lipids (Alabaster, AL, USA). The influenza Ha2 Fp was purchased from GL Biochem (Shanghai, China). Other materials were typically purchased from Sigma-Aldrich (St. Louis, MO). The Fp sequence is GLFGAIAGFIENGWEGMIDGGGKKKKG. The underlined segment is the 20 N-terminal residues of the Ha2 subunit of the hemagglutinin protein (H3 subtype) and the C-terminal segment is non-native residues that greatly increase Fp solubility in aqueous solution so that Fp binding to membrane can be done without organic solvent or detergent additives. The Fp was prepared by Fmoc solid-phase peptide synthesis and purified by reverse-phase HPLC. GL Biochem stated that Fp purity > 95% and this statement is consistent with the electrospray ionization mass spectrum that we acquired (Fig. S1).
Figure 3.

Chemical structures of POPC and POPG lipids with site numbering of the acyl chains with prime (‘) for the palmitoyl chain and no prime for the oleoyl chain.
Membrane samples.
(1) Lipid (~50 μmole) was dissolved in 2 ml chloroform:methanol (9:1 v/v) and the solvent removed by nitrogen gas and then overnight vacuum. (2) The dried lipid was suspended in ~2 mL of 10 mM HEPES/5 mM MES buffer at pH 5.0 and the suspension was subjected to freeze-thaw cycles (~10×). (3) The suspension was subjected to ultra-centrifugation at 150000g at 4 °C for 2 hours. (4) The harvested lipid pellet was lyophilized. (5) A hydrated lipid sample was prepared in a 3.2 mm outer-diameter NMR rotor by adding in sequence a ~10 μL aliquot of water, a portion of the lipid pellet, and then another aliquot of water. The total volume was ~40 μL. The top cap was placed on the rotor followed by overnight incubation at ambient temperature for membrane hydration. Evidence for hydration includes wet appearance and reproducible 13C NMR linewidths (~0.3 ppm full-width at half-maximum).
Membrane samples with Mn2+.
An aqueous solution was prepared with [MnCl2] either ~40 mM or ~4 mM and an aliquot added to the lipid suspension after step 2. The suspension was then subjected to freeze-thaw cycles (~5×) to promote homogeneous distribution of Mn2+ in the sample.60 After step 3 ultracentrifugation, [Mn2+]free was detected in the supernatant using an Agilent/Varian AA240 atomic absorption spectrometer with air-acetylene flame and 279.5 nm wavelength. Instrument calibration was done with MnCl2 standard solutions in HEPES/MES buffer at pH 5. The Mn2+ not in the supernatant was considered bound to the membrane and %Mn2+ = (mole bound Mn2+)/(mole lipid) × 100.
Membrane samples with Fp.
A solution was prepared with [Fp] ≈ 1 mM in HEPES/MES buffer at pH 5.0. The solution was added dropwise to the lipid suspension after step 2 so that the Fp:lipid ≈ 1:30 molar ratio. The Fp/lipid suspension was subjected to freeze/thaw cycles (~5×) and then gently agitated overnight. If Mn2+ was to be included in the sample, the MnCl2 solution was added before the freeze/thaw cycles. After step 3 ultracentrifugation, [Fp]free was measured in the supernatant using A280 and if MnCl2 had been added, [Mn2+]free was measured in the supernatant using flame atomic absorption spectroscopy.
NMR spectroscopy.
Data were acquired on a NMR spectrometer with 9.4 T magnet, Bruker Neo console, and Bruker Efree magic angle spinning (MAS) probe designed for lower dielectric heating of aqueous samples and for a rotor with 3.2 mm outer diameter. NMR data were acquired at 298 K with 8.0 kHz MAS frequency, 13C transmitter at 100.0 ppm, and 1H transmitter at 3.5 ppm. Fig. 4 displays the pulse sequence with 1H→ 13C cross polarization (CP) followed by dephasing with Hahn echo, and then 13C acquisition, with 1H decoupling during dephasing and acquisition.63,64 CP parameters were varied to yield highest aliphatic intensity and typically included a 2.5 μs 1H π/2 pulse followed by 1.4 ms contact time with 42 kHz 1C radiofrequency (rf) field and 1H rf field with a linear ramp between 44 and 60 kHz. The Hahn echo was τ/2- 13C π pulse-τ/2. Data were collected for a range of τ typically between ~2 and ~40 ms and the 10.0 μs 13C π pulse was rotor-synchronized with the start of dephasing. There was 50 kHz rf field of the 1H SPINAL-64 decoupling, acquisition with 25 μs dwell time and 1400 complex points, 1 s recycle delay, and sum of 8 or 16 K scans. The phases of 1H π/2, 13C CP, 13C π, and receiver were cycled: (y, x, x, x); (-y, x, -x, -x); (y, -x, -x, -x); (-y, -x, x, x); (y, y, y, y); (-y, y, -y, -y); (y, -y, -y, -y); (-y, -y, y, y). The 8-step phase cycle includes 180° alternation of the 1H π/2 phase and correlated quadrature alternation of the 13C CP, 13C π, and receiver phases. Spectra were referenced using the methylene peak of adamantane at 40.5 ppm peak and the terminal lipid chain 13CH3 peak at 13.9 ppm.
Figure 4.
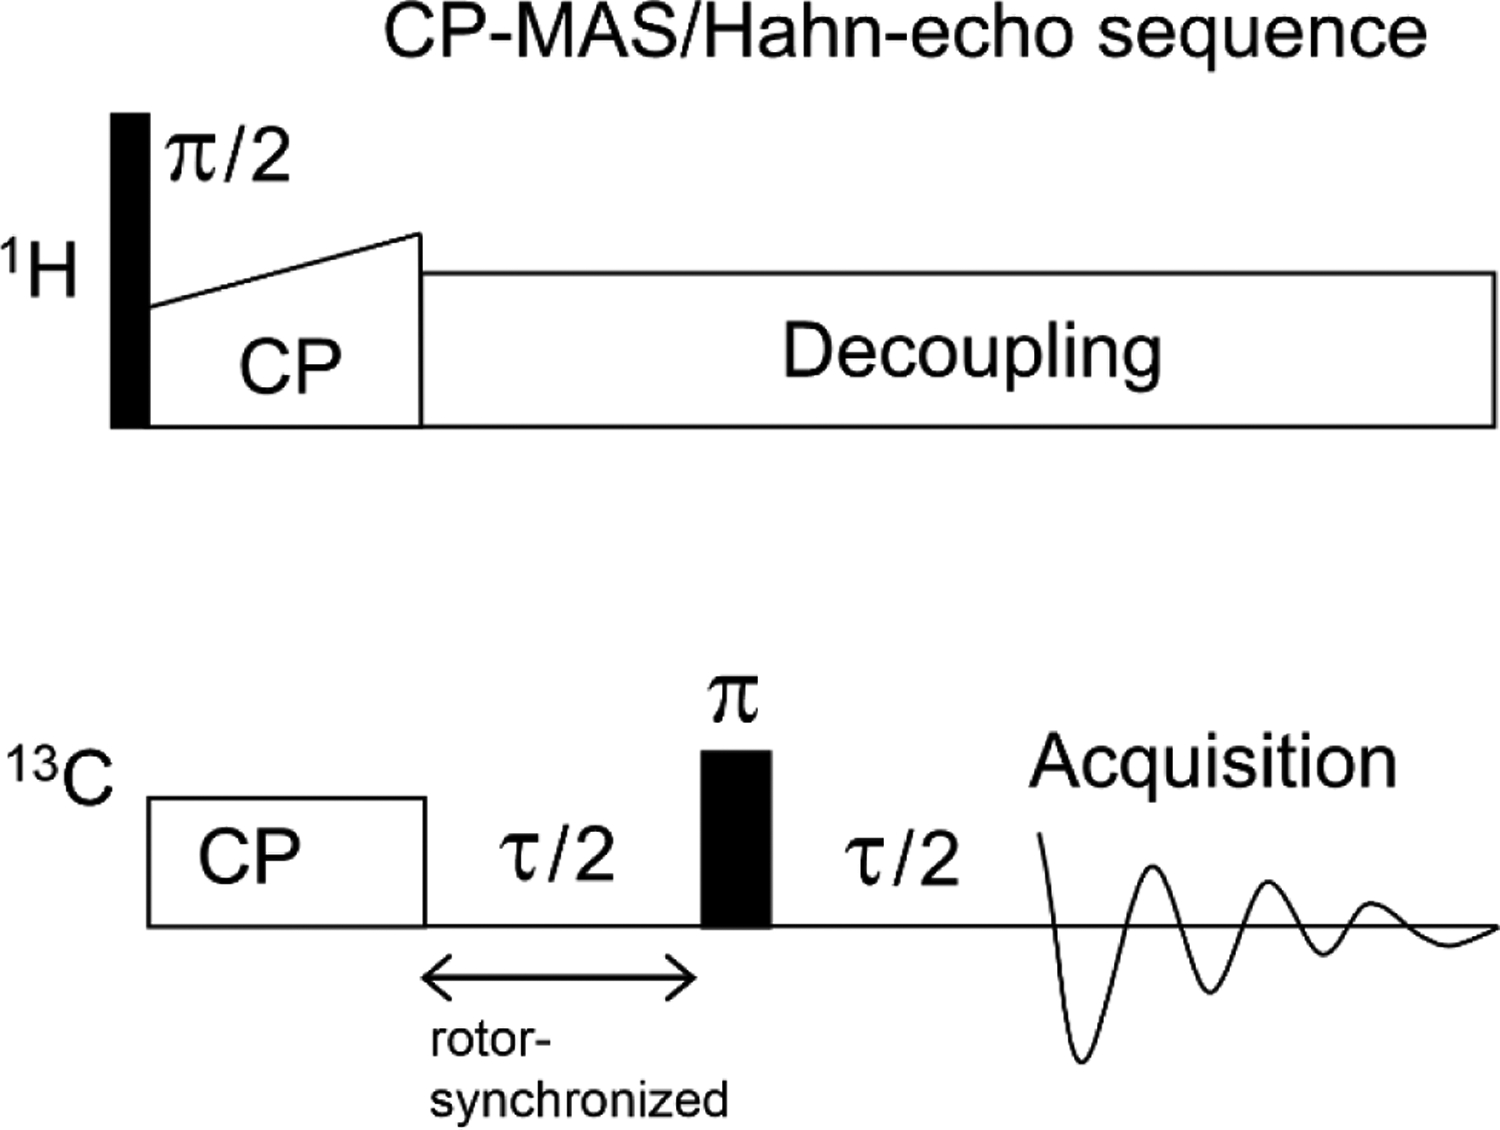
CP-MAS/Hahn-echo sequence displayed as rf field vs. time. Typical parameters included 1H transmitter at 3.5 ppm, 13C transmitter at 100.0 ppm, 8.0 kHz MAS frequency, 2.5 μs 1H π/2 pulse, 1.4 ms CP contact time, an array of τ between ~2 and ~40 ms with τ/2 an integral number of rotor periods, 10.0 μs 13C π pulse, SPINAL-64 1H decoupling during the Hahn-echo and acquisition periods, 13C acquisition with 25 μs dwell time and 1400 complex points, 1 s recycle delay, and sum of 8 or 16 K acquisitions using the phase cycle described in the text. Typical 1H rf fields are: CP, linear ramp between 44 and 60 kHz; and decoupling, 50 kHz. The typical 13C CP rf field is 42 kHz.
The 1H recycle delay of 1 s was chosen based on earlier studies that showed the 1H longitudinal relaxation rate is ~1.6 s−1 for lipid -CH2 groups in the liquid-crystalline phase.65,66 The 1 s recycle delay is close to the ~0.8 s delay for optimal (signal-to-noise)/time. Longer 1H recycle delay results in larger initial 1H magnetization for 1H-13C cross-polarization, but because the same delay is used throughout a data array, all the 13C intensities from the array are scaled by the same factor, and there isn’t an effect on the 13C R2 transverse relaxation rate.
The NMR data were typically processed with 8K zero-filling, 20 Hz exponential line broadening, Fourier transform, zero- and first-order phase correction, and baseline correction. Spectral peaks were integrated over specific chemical shift ranges and the peak integrals S vs. τ were fitted to S = A × exp(−R2 × τ) with A and R2 as fitting parameters.
Results
NMR sample preparation.
The goal of this study is to probe whether or not lipid acyl chains have greater probability of protrusion into the aqueous phase when Fp is membrane-bound, as has been observed in some simulations. There are several considerations for sample preparation including lipid composition of the membrane and optimal mole% values of membrane-bound Fp and Mn2+, where %Fp or %Mn2+ = (mole Fp or Mn2+)/(mole lipid) × 100. One consideration for %Fp is simulation data showing that protrusion probability is increased by a factor of 4–20× for lipids next to a Fp, whereas changes are much smaller for more distant lipids.49–51 During NMR data collection, a lipid molecule experiences rapid lateral diffusion in the liquid-crystalline phase and will spend time both next to and further from a Fp.67–69 Larger %Fp is anticipated to result in greater fraction of time next to Fp but there will also be undesired effects if %Fp is too large. These include oligomeric β sheet rather than monomer helical hairpin Fp structure, with the latter being the likely Fp structure in full-length Ha2.15,70 For the 3% Fp of our samples, earlier studies evidence that the Fp adopts monomer helical hairpin structure and the membrane retains the liquid-crystalline bilayer phase.29,37,38,48,71,72 This retention was supported by comparison between lipid samples without vs. with Fp. The two sample types exhibited similar lineshapes, linewidths, and relaxation rates for both their 31P and 2H static NMR spectra.
We first prepared POPC samples because the earlier simulations had typically used POPC. For sample preparation with an aliquot corresponding to 5% Mn2+, the [Mn2+]free ≈ 0 in the supernatant after centrifugation which correlates with ~5% bound Mn2+, i.e. complete binding to lipid. By contrast, most Mn2+ did not bind to POPC with 3% bound Fp. The low binding may be due to electrostatic repulsion between Mn2+ and Fp, where the calculated Fp charge is +1.6. We switched to POPC:POPG (4:1), referred to as “PC:PG”, with the choice of POPG based on its −1 charge and on otherwise similar properties to POPC.73 For sample preparation with an aliquot corresponding to 5% Mn2+, the [Mn2+]free correlated with ~5% bound Mn2+ for PC:PG without Fp and ~4% bound Mn2+ for PC:PG with 3% Fp. For PC:PG either without or with Mn2+, there was complete binding of Fp to lipid, based on A280 ≈ 0 in the supernatant after centrifugation. This result is consistent with Fpbound:Fpfree ≈ 104 calculated by Kbind × [lipid] where Kbind ≈ 106 M−1 is the previously-determined binding constant and [lipid] ≈ 10−2 M in our sample preparation.25
13C CP NMR spectra without Hahn echo are displayed for the lipid samples in Fig. 5 either (a) without or (c) with Fp. Assignments are shown for the lipid acyl chain peaks use the Fig. 3 carbon numbering with prime (‘) for the palmitoyl chain and no prime for the oleoyl chain.62 There typically isn’t resolution of individual peaks for POPC vs. POPG. There are resolved peaks for sites with distinctive bonding environments, but with superposition of signals from at least two sites. The 9,10 peak exhibits partial resolution of the 9 and 10 signals at higher and lower shift, respectively. The * peak is a superposition of signals from the 4–7, 12–15, and 4’−13’ sites. For the same lipid site peak, there are negligible spectral shift or width differences for samples without vs. with Fp. There aren’t peaks that could correspond to Fp signals, with possible explanations being the: (1) 3% Fp concentration; and (2) broader Fp linewidths because of less motional averaging for Fp vs. lipid.
Figure 5.
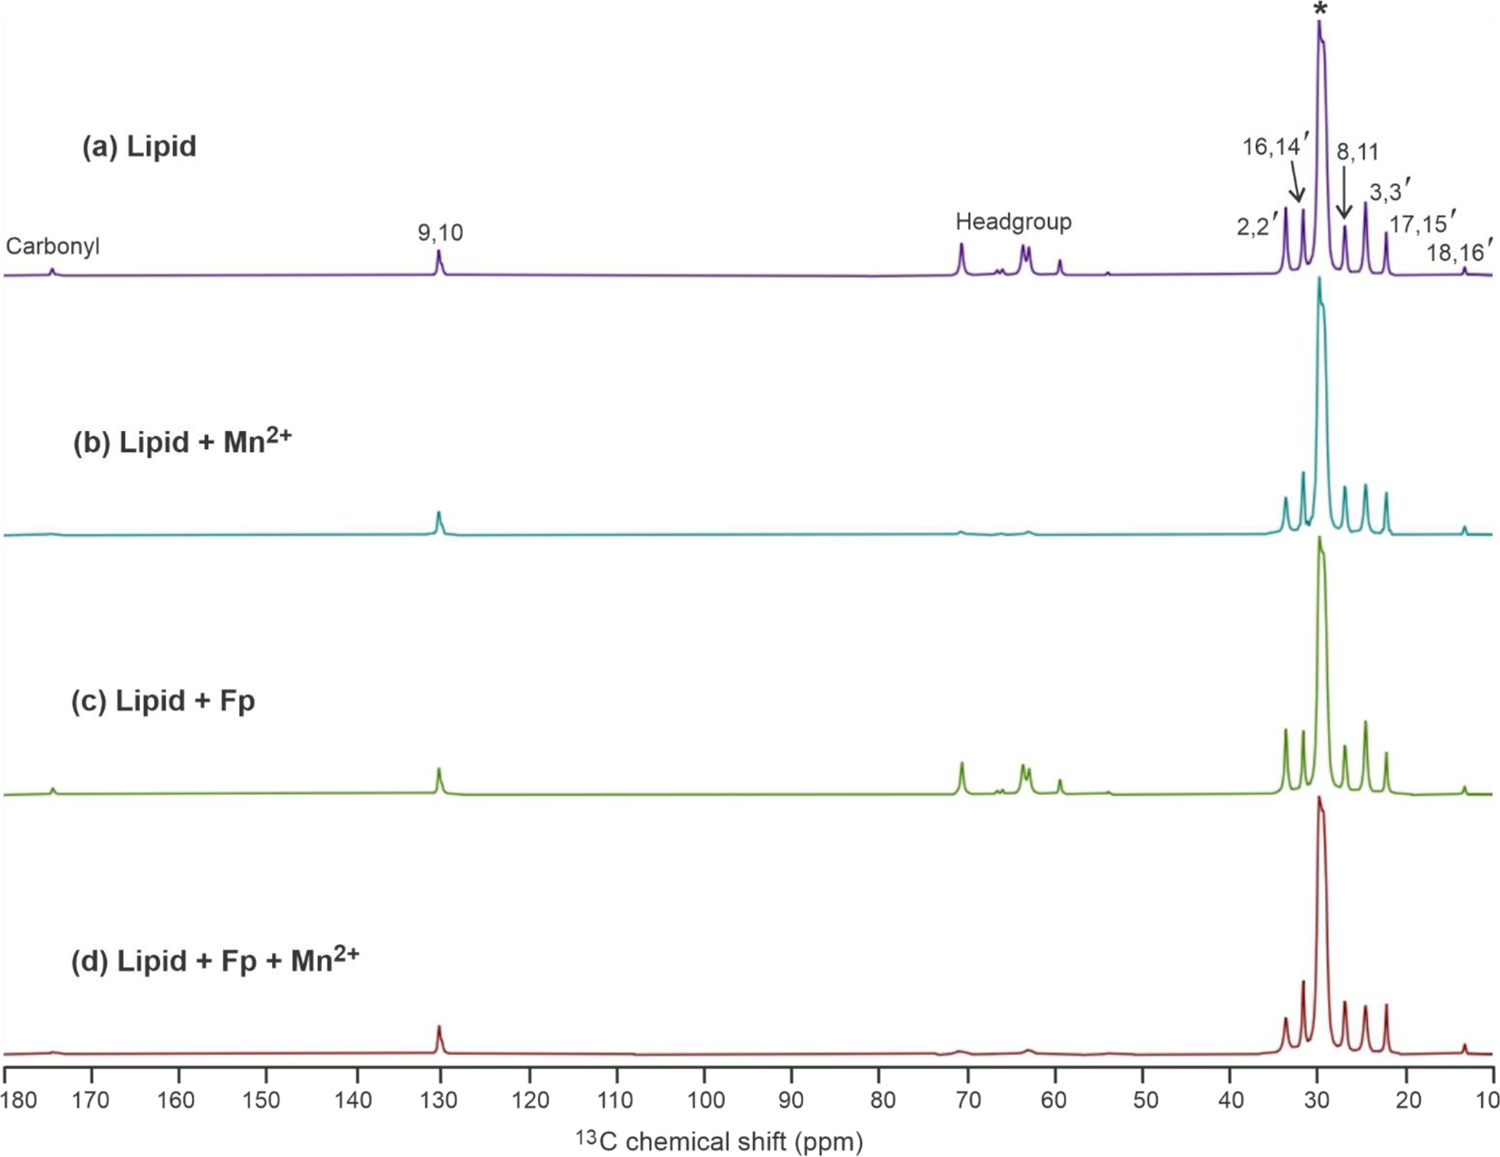
13C NMR spectra of samples containing (a) Lipid, (b) Lipid + Mn2+, (c) Lipid + Fp, and (d) Lipid + Fp + Mn2+, with 0.5% Mn2+ and 3% Fp that are calculated as (mole Mn2+ or Fp)/(mole lipid) × 100. There is POPC:POPG (4:1) lipid composition. The data were acquired after CP without the Hahn echo. The vertical scales of the four spectra have been adjusted so that the “*” peaks at 30 ppm have the same height. Assignments are displayed for the lipid acyl chain peaks use the Fig. 2 carbon numbering with prime (‘) for the palmitoyl chain and no prime for the oleoyl chain. There isn’t resolution of individual peaks for POPC vs. POPG. There are resolved peaks for sites with distinctive bonding environments, but with superposition of signals from at least two sites. Peaks are assigned for: (1) the 2,2’ and 3,3’ sites that are one and two bonds from the carbonyl groups; (2) the 9,10 C=C and 8,11 C=C adjacent sites of the oleoyl chain; (3) the 18,16’ -CH3 sites; and (4) the 17,15’ and 16,14’ sites that are one and two bonds from the -CH3 groups. The * peak is a superposition of signals from the 4–7, 12–15, and 4’−13’ sites. The carbonyl peak and headgroup peak regions are also noted.
We first measured the effect of %Mn2+ on 13C R2, with the goal of finding the optimal %Mn2+ for detection of lipid protrusion using the R2 difference between samples with vs. without Mn2+, i.e. Γ2 = R2,Mn – R2,NoMn. The Fp effect on protrusion is assessed by comparison of Γ2,Fp vs. Γ2,noFp. The Mn2+ is likely close to the negatively-charged lipid phosphate oxygens in a lipid headgroup. The Γ2 ∝ 〈r−6 〉 where r is the 13C-Mn2+ distance and 〈…〉 is the average over the ~10 ms NMR measurement time.59 The 〈r−6 〉 will depend on %Mn2+ as well as lipid 13C site (Figs. 2, 3). We hypothesized that increased lipid protrusion with Fp could be mostly clearly observed if Γ2,noFp were comparable or smaller than R2,noMn,noFp. This is based on the idea that Fp-induced increases in 〈r−6 〉 would be more readily detectable if Γ2,noFp isn’t already approaching its maximal value. We first tried 5% Mn2+ in lipid without Fp and observed complete loss of the 2,2’ and 3,3’ signals as well as apparent Γ2/R2,noMn ratios of ~10 for 8,11 and 9,10, ~6 for *, and ~5 for 16,14’. We then investigated %Mn2+ in the 0.5 – 1.25% range and observed that even at 0.5%, Γ2 > 0 for many peaks and Γ2/R2 < 1 for all peaks (Tables 1, S1, and S2). We then prepared samples with 0.5% Mn2+ for more complete analysis. There was no detectable [Mn2+]free for the lipid without Fp sample and small [Mn2+]free for the lipid with Fp sample. The %Mn2+ bound were 0.50 and 0.48%, respectively.
Table 1.
Site-specific 13C transverse relaxation rates of acyl chains of POPC:POPG (4:1) membrane and % Mn2+ dependence (fitting uncertainties in parentheses)a
| Mn2+ | 13C R2 (s−1) | 13C Γ2 (s−1) | ||||||
|---|---|---|---|---|---|---|---|---|
| % | 2,2′ | 3,3′ | * | 16,14′ | 2,2′ | 3,3′ | * | 16,14′ |
| 0 | 28.1(1.2) | 20.3(1.0) | 15.9(0.2) | 13.9(0.9) | ||||
| 0.5 | 50.2(1.8) | 34.3(2.2) | 20.5(0.9) | 15.4(1.0) | 22.1(2.5) | 14.0(2.4) | 4.6(0.9) | 1.4(1.3) |
| 0.75 | 81.9(6.3) | 59.1(3.4) | 26.4(0.9) | 13.7(1.9) | 53.8(6.5) | 38.8(3.5) | 10.5(0.9) | −0.2(2.1) |
| 1.00 | 92.1(3.4) | 60.8(4.6) | 28.4(1.5) | 22.0(1.4) | 64.0(3.8) | 40.5(4.7) | 12.5(1.5) | 8.1(1.6) |
| 1.25 | 93.9(7.0) | 67.8(5.8) | 29.2(1.4) | 20.7(1.9) | 65.8(7.2) | 47.6(5.9) | 13.3(1.4) | 6.8(2.1) |
Each 13C transverse relaxation rate (R2) was determined from best-fitting the integrated NMR peak intensity S vs. delay time τ using S = A × exp(−R2 × τ) where A and R2 are fitting parameters. The fitting uncertainty of R2 is given in parentheses. The Γ2 values are the differences between the best-fit R2 values of samples with vs. without Mn2+. The * peak is the superposition of the 4–7, 12–15, and 4’−13’ signals. The typical ppm integration ranges for peaks are: 2,2’, 33.00–37.00; 3,3’, 24.00–26.30; *, 28.30–31.50; 16,14’, 31.50–33.00. The % Mn2+ = (mole bound Mn2+)/(mole lipid) × 100.
13C NMR spectra and relaxation.
Fig. 5 displays the 13C CP NMR spectra without Hahn echo of the (b) lipid + Mn2+ and (d) lipid + Fp + Mn2+ samples with comparison to the (a, c) samples without Mn2+. The vertical scales of the four spectra have been adjusted so that the * peaks at 30 ppm have the same height. For the same lipid site peak, there is negligible spectral shift without vs. with Mn2+. For both lipid and lipid + Fp, there is attenuation of the lipid 2,2’ and 3,3’ peak intensities with vs. without Mn2+, whereas there is not obvious attenuation for the 16,14’, 17,15’, and 18,16’ peaks. In addition, the lipid headgroup and CO signals are highly attenuated by Mn2+.
Fig. 6 displays 2,2’ spectral signal intensities vs. Δτ (increment in dephasing time) of the four samples. The spectra were acquired with the CP-Hahn echo sequence (Fig. 4). The vertical scales of the spectra of each sample were adjusted so that the Δτ = 0 spectral peaks of all samples have the same height. The signal intensities of the (a) lipid and (c) lipid + Fp samples exhibit semi-quantitatively similar attenuation of signal intensities with Δτ. There is greater attenuation for the (c) lipid + Mn2+ sample and even greater attenuation for the (d) lipid + Fp + Mn2+ sample. Fig. 6 provides qualitative spectral evidence which supports the hypothesis that bound Fp induces higher probability of lipid protrusion. Although the shortest τ value was 1.25 ms for panel (a) vs. 2.00 ms for (b-d), the NMR intensity S(τ) for all data was close to the S(0) intensity prior to relaxation-associated decay, i.e. the S(τ)/S(0) ratio in (a-d) is ~ 0.96, 0.90, 0.95, and 0.88, respectively, as calculated using the R2 rates described in the next paragraph.
Figure 6.
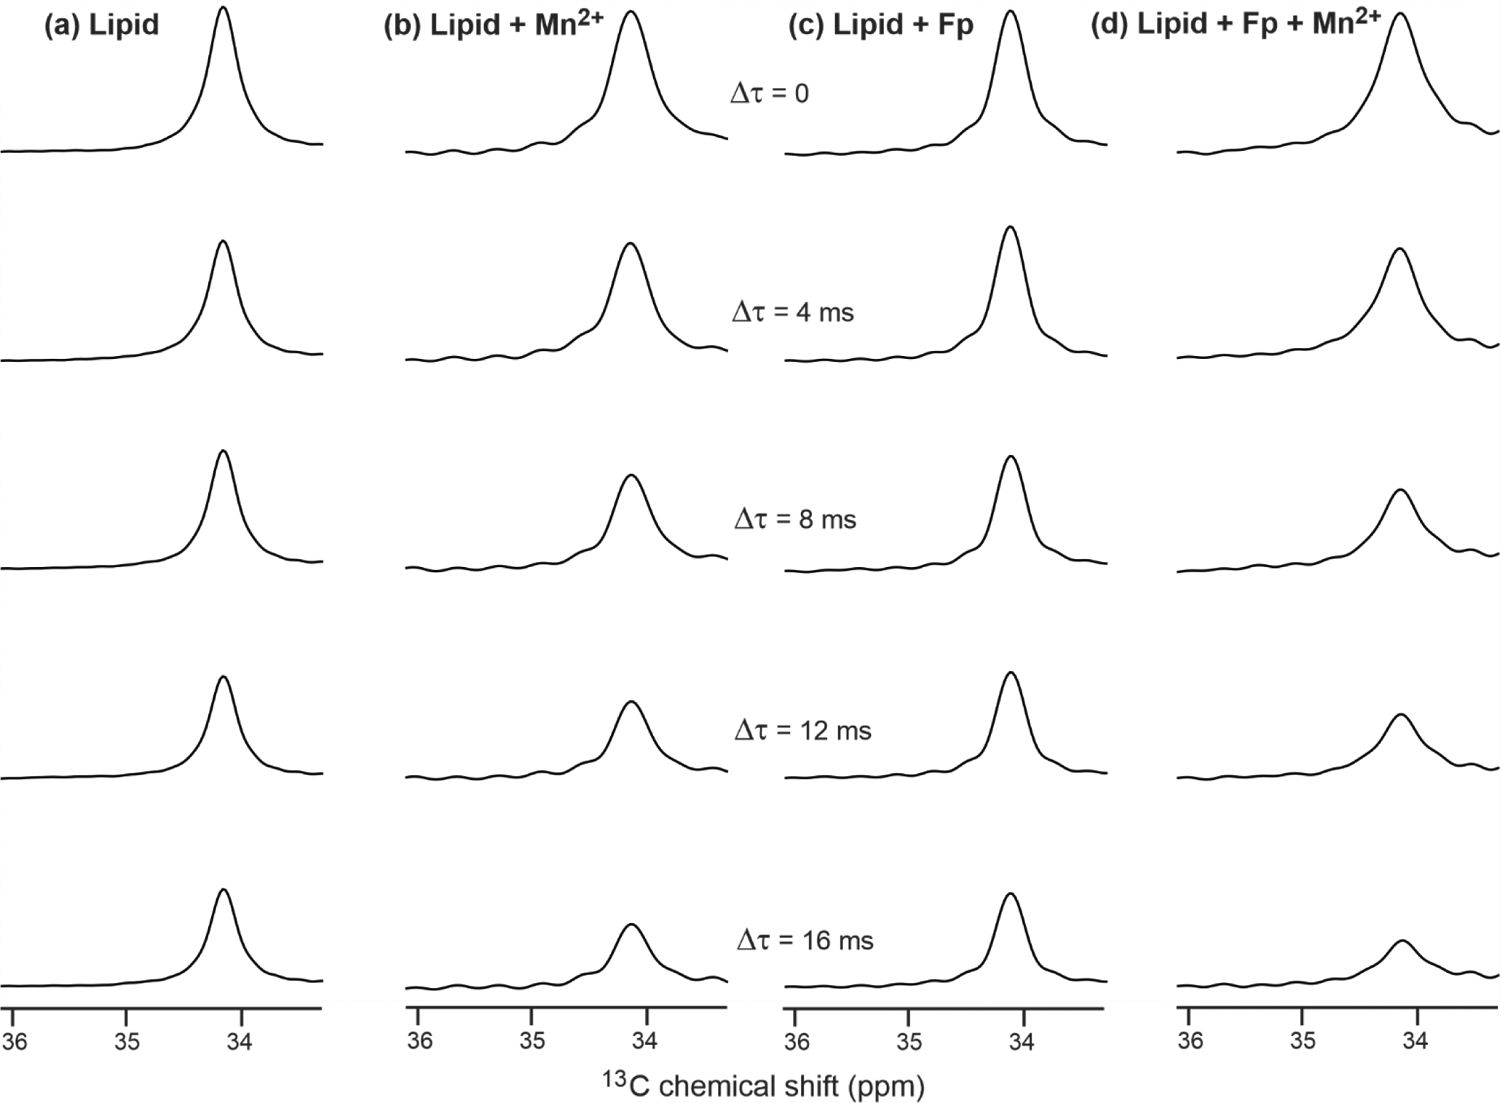
The 2,2’ spectral signals vs. Δτ (increment in dephasing time) of samples containing (a) Lipid, (b) Lipid + Mn2+, (c) Lipid + Fp, and (d) Lipid + Fp + Mn2+, with 0.5% Mn2+ and 3% Fp that are based on (mole Mn2+ or Fp)/(mole lipid) × 100. Spectra were acquired with the CP-Hahn echo sequence. The vertical scales of the spectra of each sample were adjusted so that the Δτ = 0 spectral peaks have the same height. For these top spectra, τ = 1.25 ms for (a) and 2.00 ms for (b-d).
The integrated intensities vs. τ of each acyl chain -CH2 signal were fitted to single exponential decays, i.e. S(τ) = A × exp(−R2 × τ) where A and R2 are fitting parameters. Fig. 7 displays plots and fittings of S(τ)/A vs. τ for some of the signals and Table 2 gives the best-fit R2’s for all fittings as well as the Γ2’s, the R2 changes for samples with vs. without Mn2+. Table 2 provides the uncertainties in the R2 and Γ2 values in parentheses. Fitting is done both for the full integration range of the * peak and for smaller integration ranges of partially-resolved peaks with predominant contributions from a more limited number of sites (Fig. S2). The uncertainties of the experimental peak intensities were calculated as the standard deviations of the integrated intensities in noise regions of the spectra. For two-site peaks, these experimental uncertainties were typically between 10−3 and 10−2, i.e. smaller than the dimensions of points in the plots in Figure 7. Fig. S3 displays the data and fittings on a logarithmic scale. Fig. 8 displays a bar plot of the Γ2’s of samples without vs. with Fp, with data from each of the resolved peaks that are due to two 13C sites in the acyl chains (Fig. 5). Table 3 lists the experimental linewidths (Δν’s) of the peaks in the four samples as well as differences Δ[Δν] with vs. without Mn2+. Table 4 provides the inhomogeneous contributions to the linewidths of the resolved peaks, calculated using Δνinhom = Δνexp – R2/π. The Δνinhom values are shown for resolved peaks of individual samples, along with average values for the four samples and associated standard deviations.
Figure 7.
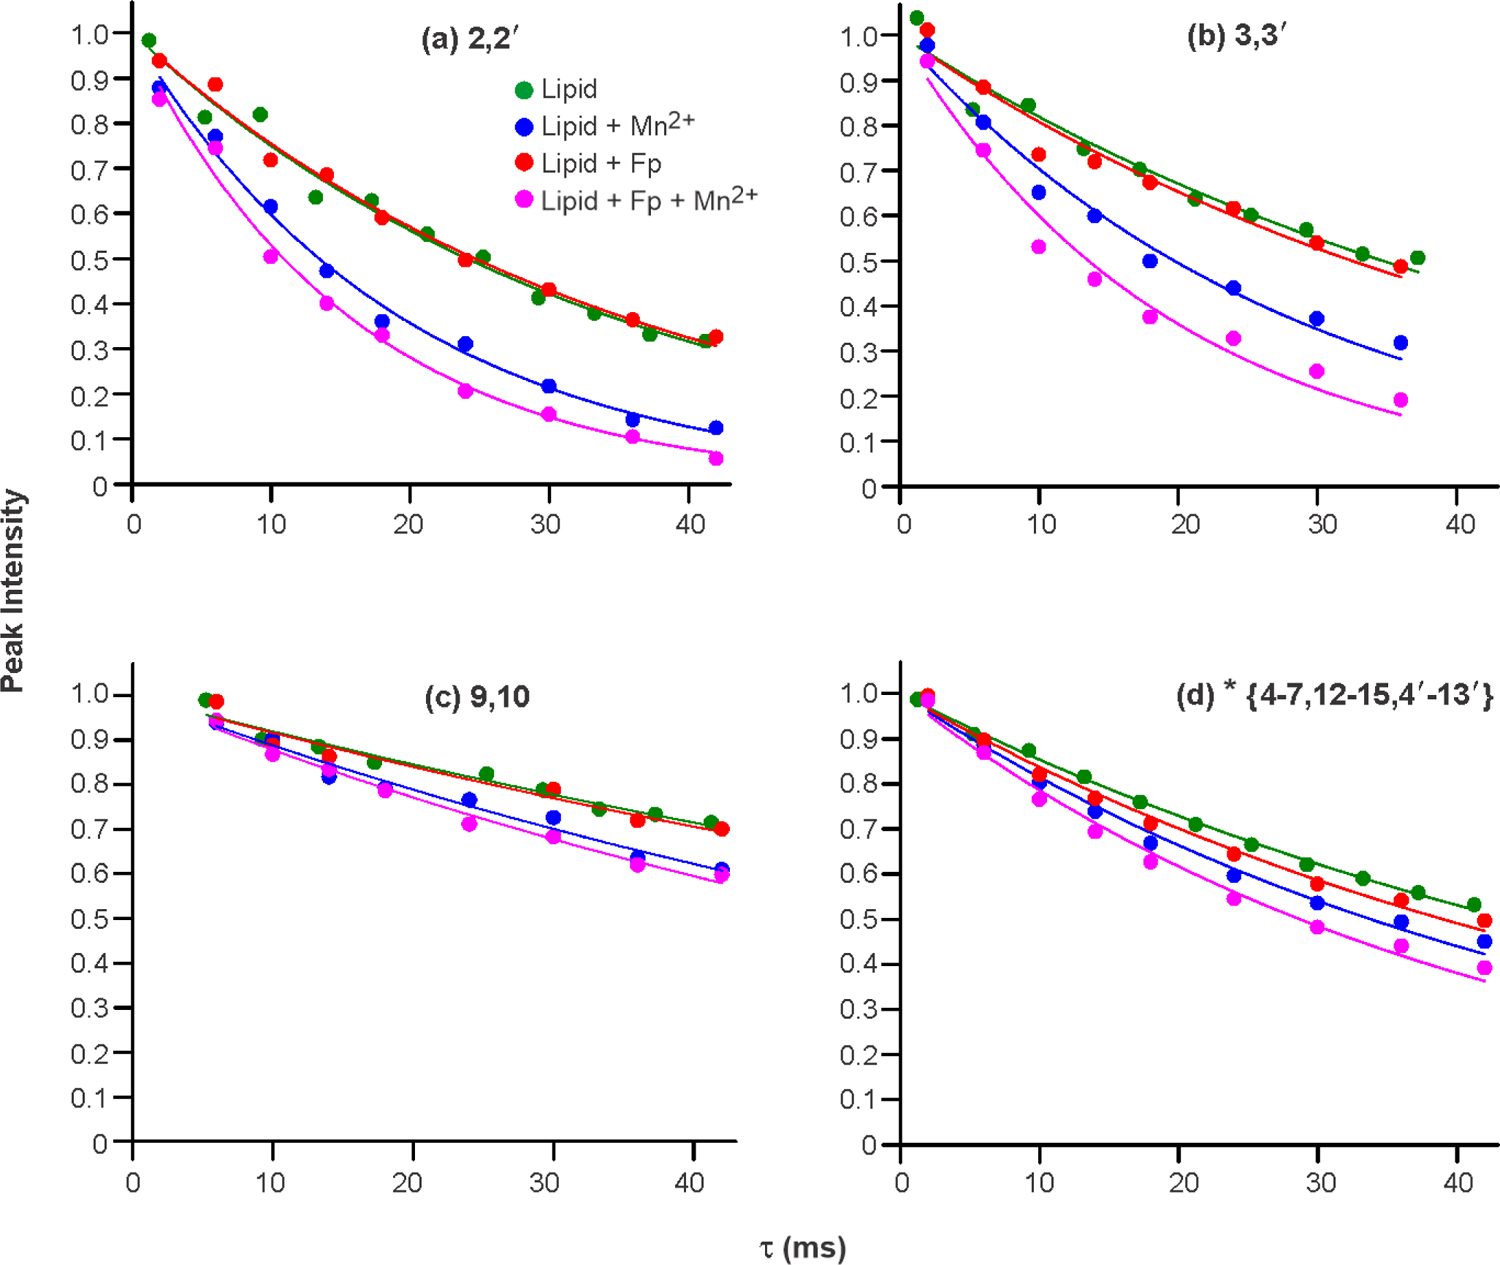
Integrated peak intensities vs. dephasing time (τ) and best-fit single exponential decays for the Lipid, Lipid + Mn2+, Lipid + Fp, and Lipid + Fp + Mn2+ samples. Data and fittings are displayed for the (a) 2,2’; (b) 3,3’; (c) 9,10; and (d) * peaks. The * peak is a superposition of signals from the 4–7, 12–15, and 4’−13’ sites. The peak intensities vs. τ were fitted to A × exp(−R2 × τ) with A and R2 as fitting parameters. The displayed intensities have been divided by A so that the best-fit intensity = 1 for all peaks when τ = 0. The best-fit R2’s and their uncertainties are presented in Table 2. The uncertainties in the peak intensities were calculated as the RMSD’s of ten different integrals in noise regions of the spectra. For the two-site peaks, these uncertainties were typically between 10−3 and 10−2 and less than the dimension of the points in the plots.
Table 2.
Site-specific 13C transverse relaxation rates of acyl chains of POPC:POPG (4:1) membrane and Mn2+ and Fp dependences (uncertainties in parentheses)a
| 13C | R2 (s−1) | Γ2 (s−1) | ||||
|---|---|---|---|---|---|---|
| w/o Fp | 3% Fp | w/o Fp | 3% Fp | |||
| w/o Mn2+ | 0.5% Mn2+ | w/o Mn2+ | 0.5% Mn2+ | |||
| 2,2′ | 28.8(1.4) | 51.5(2.1) | 28.1(1.2) | 63.5(3.2) | 22.8(2.6) | 35.4(3.4) |
| 3,3′ | 20.0(1.5) | 35.2(2.4) | 21.3(2.0) | 51.1(4.0) | 15.2(2.8) | 29.8(4.1) |
| 8,11 | 9.1(0.7) | 12.6(0.9) | 13.6(1.6) | 19.8(1.7) | 3.5(1.2) | 6.2(2.3) |
| 9,10 | 8.4(0.6) | 11.9(0.8) | 8.7(1.0) | 13.0(1.2) | 3.5(1.0) | 4.3(1.2) |
| 16,14′ | 15.5(0.7) | 15.0(0.6) | 13.8(0.8) | 15.4(0.7) | −0.5(0.9) | 1.5(1.0) |
| 17,15′ | 5.9(0.7) | 7.3(0.4) | 8.6(0.8) | 9.7(1.0) | 1.4(0.8) | 1.1(1.2) |
| *{4–7,12–15,4′−13′} | 15.8(0.3) | 20.5(0.9) | 17.8(0.7) | 24.1(1.1) | 4.7(0.9) | 6.4(1.3) |
| *1{ 6′−9′} | 24.8(0.2) | 27.2(1.5) | 25.4(0.5) | 30.3(0.3) | 2.5(1.6) | 4.9(0.6) |
| *2{ 7,10′,11′} | 15.1(0.2) | 16.4(0.9) | 16.0(0.7) | 23.2(1.0) | 1.3(0.9) | 7.2(1.2) |
| *3{4–6,12–15,4′,5′,12′,13′} | 11.7(0.3) | 18.8(0.9) | 15.8(1.2) | 23.1(1.8) | 7.1(1.0) | 7.4(2.2) |
Each 13C transverse relaxation rate (R2) was determined from best-fitting the integrated NMR peak intensity S vs. delay time τ using S(τ) = A × exp(−R2 × τ) where A and R2 are fitting parameters. The fitting uncertainty of R2 is given in parentheses. The Γ2 values are the differences between the best-fit R2 values of samples with vs. without Mn2+. Typical ppm integration ranges for peaks are: 2,2’, 33.00–37.00; 3,3’, 24.00–26.30; 8,11, 26.50–28.20; 9,10, 128.00–131.00; 16,14’, 31.50–33.00; 17,15’, 21.50–23.60; *, 28.30–31.50; *1, 30.24–31.50; *2, 30.04–30.24; *3, 28.30–30.04 (Fig. S2). The 13C sites that make the largest contributions to the *1, *2, and *3 integration ranges are listed between the brackets. The % Mn2+ = (mole bound Mn2+)/(mole lipid) × 100. The % Fp is calculated using the same type of expression.
Figure 8.

Bar plot of the Γ2’s, i.e. the differences between the R2’s for samples with vs. without Mn2+. The Γ2’s are displayed for several peaks. Each peak is due to signals from two 13C sites in the acyl chains. The Γ2’s are shown for samples without vs. with Fp. The Γ2’s and their uncertainties are presented numerically in Table 2.
Table 3.
Site-specific 13C FWHM NMR linewidths of acyl chains of POPC:POPG (4:1) membrane and Mn2+ and Fp dependencesa
| 13C | Δν (Hz) | Δ[Δν] (Hz) | ||||
|---|---|---|---|---|---|---|
| w/o Fp | 3% Fp | w/o Fp | 3% Fp | |||
| w/o Mn2+ | 0.5% Mn2+ | w/o Mn2+ | 0.5% Mn2+ | |||
| 2,2′ | 33.1 | 43.2 | 34.8 | 49.4 | 10.1 | 14.6 |
| 3,3′ | 37.3 | 43.1 | 38.7 | 47.8 | 5.8 | 9.1 |
| 8,11 | 39.7 | 42.8 | 38.8 | 44.1 | 3.1 | 5.3 |
| 9,10 | 33.0 | 39.4 | 33.7 | 36.4 | 6.4 | 2.7 |
| 16,14′ | 30.0 | 34.7 | 30.0 | 31.1 | 4.7 | 1.1 |
| 17,15′ | 27.5 | 32.9 | 28.1 | 28.9 | 5.4 | 0.8 |
| *{4–7,12–15,4′−13′} | 110.7 | 112.4 | 111.7 | 116.0 | 1.7 | 4.3 |
These are experimental full-width at half-maximum linewidth of the 13C signal of the CP NMR spectrum. The Δ[Δν] is the difference in linewidths between samples with vs. without Mn2+.
Table 4.
Inhomogeneous contributions to site-specific 13C FWHM NMR linewidths of acyl chains of POPC:POPG (4:1) membranea
| 13C | Δνinhom (Hz) | Average | |||
|---|---|---|---|---|---|
| w/o Fp | 3% Fp | ||||
| w/o Mn2+ | 0.5% Mn2+ | w/o Mn2+ | 0.5% Mn2+ | ||
| 2,2′ | 23.9 | 26.8 | 25.9 | 29.2 | 26.4(1.9) |
| 3,3′ | 30.9 | 31.9 | 31.9 | 31.5 | 31.6(0.4) |
| 8,11 | 36.8 | 38.8 | 34.5 | 37.8 | 37.0(1.6) |
| 9,10 | 30.3 | 35.6 | 30.9 | 32.6 | 31.6(2.0) |
| 16,14′ | 25.1 | 29.9 | 25.6 | 26.2 | 27.0(1.9) |
| 17,15′ | 25.6 | 30.6 | 25.4 | 25.8 | 26.8(2.2) |
The Δνinhom = Δνexp – (R2/π) i.e. the difference between the experimental full-width at half-maximum linewidth and the experimental relaxation contribution to the linewidth. The average is for the four samples with the standard deviation in parentheses.
The four samples for Figs. 5–8 were prepared around the same time and as similarly as possible other than the prescribed absence vs. presence of Mn2+ and/or Fp. Replicate datasets were acquired and analyzed and Table S3 provides the best-fit R2’s for the replicate data. The differences in best-fit R2’s between replicates are typically comparable to the uncertainties for the differences. Table S4 displays best-fit R2’s for replicate samples and the R2’s are also similar between samples.
Discussion
Hydration and location of Mn2+ in samples.
The lipids in the samples were likely close to full hydration. Water was added to the rotor both before and after the lipid is added, i.e. the water was initially both underneath and on top of the lipid. The rotor was then sealed with the top cap followed by >12 hours prior toacquisition of NMR spectra, and this incubation time was intended to promote water permeation and homogenous hydration of the lipid. Such hydration is evidenced by the: (1) wet appearance of the sample, including after the NMR experiments were completed; and (2) 13C symmetric lineshapes with narrow (~0.3 ppm FWHM) linewidths. We also anticipate little evaporation of water because the rotor was sealed, the MAS frequency was moderate (8 kHz), and the 1H rf circuit of the NMR probe was designed to minimize dielectric heating of the water. For a typical sample, ~20 μL water was added to the rotor which has ~40 μL total volume rotor, so there is ~20 μL lipid in the sample. POPC and water have similar densities, so the lipid:water mass ratio was similar to the volume ratio. By this approach, the lipid:water mass ratio in our samples was comparable to the ~3:2 ratio for fully-hydrated lipid, which was calculated using 28 water molecules-per-lipid molecule.74
The Mn2+ likely binds the lipids rather than Fp. As noted in the Results section, membrane with only POPC lipid (with zwitterionic headgroup) quantitatively binds Mn2+ whereas POPC membrane with bound Fp doesn’t bind Mn2+. This was the reason that the NMR samples were prepared with 20 mole% POPG lipid with anionic headgroup, with resulting Mn2+ binding when peptide was also bound. In addition, the experimentally-determined pKa’s of the sidechains of the two Glu and one Asp sidechains are >5. For the NMR samples at pH 5.0, the Glu and Asp sidechains have only partial negative charge, whereas the lipid headgroups have full negative charge.75
NMR relaxation data support increased probability of lipid chain protrusion with Fp.
There are overall larger Γ2’s for lipid with vs. without Fp, and the magnitude is most pronounced for the 2,2’ and 3,3’ signals, with reductions in R2 and Γ2 values for -CH2 sites closer to the chain terminus (Figs. 6–8, Table 2). The Γ2 trend is consistent with the results of the initial molecular dynamics simulation showing increased protrusion probability with Fp and specifically with the result summarized on p. 3 of this article “…our simulations predict the [Fp] effect on tail protrusion to be most profound in the upper region of the acyl chain …”49 (Fig. 2).
Earlier NMR relaxation data were used to estimate a correlation time of ~10−8 s for the lipid chain motion that could lead to protrusion in the liquid-crystalline membrane.76,77 This time is much smaller than the characteristic (1/R2) ≈ 10−1 s for 13C transverse relaxation so the R2 is most reasonably considered as a weighted average of the chain’s high-probability unprotruded state and low-probability protruded state. We hypothesize that a site’s Γ2 is proportional to the probability of chain protrusion (Ωprot) into the headgroup region.61 This hypothesis is based on: (1) the r−−6 dependence of Γ2 where r is the 13C-Mn2+ distance; and on (2) smaller r and therefore much larger Γ2 when the chain is protruded. As described in the Results section, only 0.005 fraction of the lipid headgroups in our samples have bound Mn2+. The Mn2+ are likely also exchanging rapidly between headgroups during 13C transverse relaxation. Based on arguments similar to those above for protrusion, we additionally hypothesize that a site’s Γ2 is also proportional to the probability that a Mn2+ is bound to a headgroup close to the protruded chain (ΩMn).
We estimate r for the protruded state with nearby Mn2+ by combining our two hypotheses with the known expression for Γ2 with a nuclear spin I with spin ½ and a nearby paramagnetic species with spin quantum number L:
| (Eq. 1) |
whereμ0 is the permeability of free space, γI is the nuclear spin gyromagnetic ratio, ge is the electron spin g factor, μB is the Bohr magneton, Jω is the spectral density at angular frequency ω, and ωI is the angular NMR Larmor frequency of the nucleus.59 Using the known values ofμ0, γI for 13C, ge, andμB, and L = 5/2 for Mn2+,
| (Eq. 2) |
There are estimates below for the other terms but we note that because of the 6th root dependence, r is fairly insensitive to moderate changes in these estimates, e.g. a 10× increase in the expression in braces correlates with a 1.1× increase in r. The Jω is calculated using:
| (Eq. 3) |
where τc is the correlation time.61 The J0 = τc which is much larger than Jω I, based on τc ≈ 10−8 s, the experimentally-based estimate of the correlation time for chain motion associated with protrusion and on ωI ≈ 6 × 10⁸ s−1.76,77 We estimate ΩMn ≈ 10−2 based on a protruded 13C being near ~2 lipid headgroups and the experimental Mn2+ headgroup occupancy ≈ 0.005. For lipid without Fp, Ωprot ≈ 0.01 in simulations and the Γ2 ≈ 10 s−1 from our experimental data (Table 2). The resulting calculated r ≈ 4 Å is plausible for the 13C nuclei of a chain that protrudes into the headgroup region of the membrane.
One notable trend of Fig. 8 and Table 2 is the attenuation of Γ2 as the 13C site moves closer to the chain terminus. This trend holds for samples both without and with Fp. We have hypothesized that Γ2 ∝ Ωprot and further hypothesize that protrusion of a specific -CH2 group also means protrusion of the -CH2 groups that are closer to the lipid glycerol group. This second hypothesis is based on the location of the glycerol group close to the phosphate group and the chemical bonding of the acyl chain (Fig. 3). For the six 13C NMR signals assigned to two -CH2 sites with sites numbered x and y, respectively (Fig. 5), the average number of protruded -CH2 groups (n) is calculated:
| (Eq. 4) |
and protrusion of each -CH2 group is hypothesized to require free energy ΔGprot so that Γ2 depends on n as:
| (Eq. 5) |
where Γ2 (0) is the parameter for the rate when no -CH2 are protruded. Fig. 9 displays fitting with Eq. 5 of the experimental Γ2 (n) data vs. n, with separate fittings of data without and with Fp. The best-fit ΔGprot/ kBT are 0.249 ± 0.018 without Fp and 0.266 ± 0.016 with Fp. The Eq. 5 model is supported both by the quantitative similarity of the two values and the semi-quantitative agreement with the 0.25–0.50 kBT range for ΔGprot/ kBT in one of the simulations.49 The best-fit Γ2 (0) are 27.9 ± 1.8 s−1 without Fp and 47.3 ± 2.6 s−1 with Fp.
Figure 9.
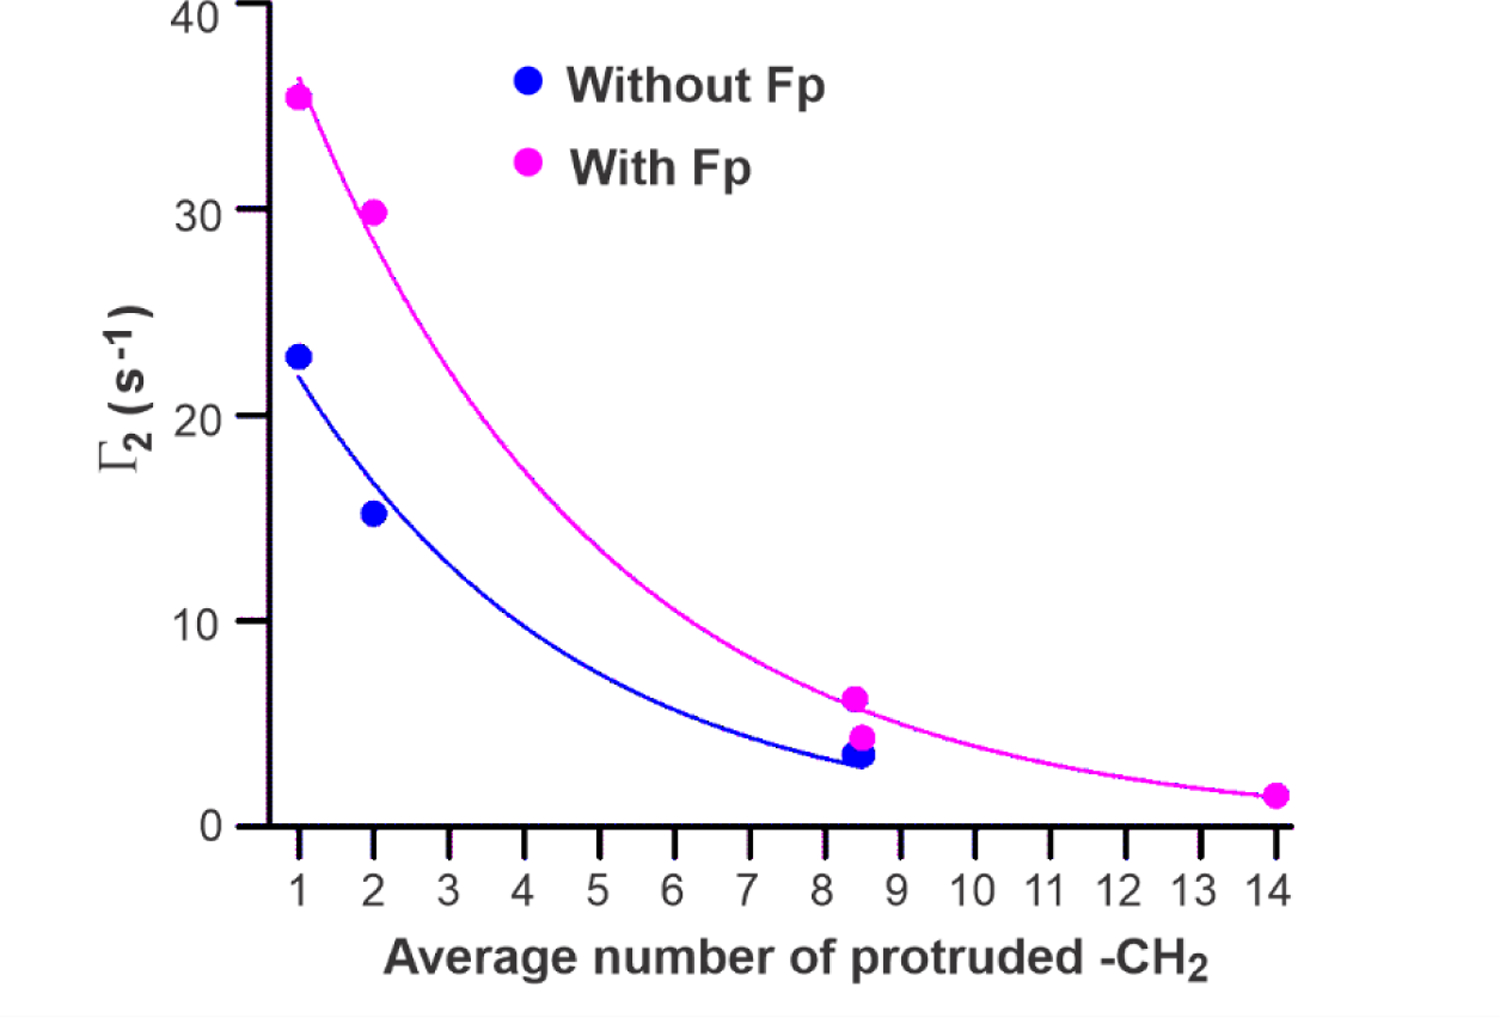
Plots and exponential decay fittings of Γ2 vs. average number (n) of protruded -CH2. For each peak corresponding to signals from two -CH2 sites that are numbered x and y (Figs. 3 and 5), this average number is calculated as [(x+y)/2] – 1, e.g. 2 for the 3,3’ peak and 14 for the 16,14’ peak. Data are displayed for samples without and with Fp. Separate fittings are done for each sample type using Γ2 (n) = Γ2 (0) × exp(−n × κ) with Γ2 (0) and κ as fitting parameters and κ = ΔGprot/kBT. Best-fit values with uncertainties in parentheses are: (1) without Fp, Γ2 (0) = 27.9(1.8) s−1 and κ = 0.249(18); and (2) with Fp, Γ2 (0) = 47.3(2.6) s−1 and κ = 0.266(16).
The molecular dynamics simulations from different groups show that the large enhancement of Ωprot is primarily for lipids next to the Fp whereas the Ωprot of more distant lipids is similar to lipids without Fp. For samples with Fp, the ~10−8 s time for lateral diffusion of a lipid molecule between Fp-neighboring and more distant locations is much more rapid than the 1/R2 relaxation time, so the Γ2,Fp will be a weighted average of the larger Fp-adjacent and smaller more distant values, Γ2,neighbor and Γ2,distant, respectively. For “q” lipid molecules neighboring a Fp and the ~3 mole% Fp of a sample:
| (Eq. 6) |
which is algebraically rewritten as:
| (Eq. 7) |
Using the best-fit Γ2,Fp(0) and Γ2,noFp(0) values and the approximation Γ2,distant(0) ≈ Γ2,noFp(0):
| (Eq. 8) |
The Γ2,Fp(0)/Γ2,noFp(0) = 1.70 ± 0.14. The value of q will depend on the Fp surface area that contacts lipids and this area will vary with location and orientation of the Fp in the membrane. There is also the possibility that q is reduced because of increased protrusion probability is mostly for a subset of neighboring lipids with spatiallyspecific Fp interactions. A reasonable possible range of q values is 1 to 8, with q = 8 based on interfacial Fp location and ~4× greater cross-sectional area for Fp vs. lipid.47,48 From Eq. 8, Γ2,neighbor/Γ2,distant = 24.3 ± 4.8 for q =1 and 3.92 ± 0.60 for q = 8. This matches the range of Γ2,neighbor/Γ2,distant ratios that were observed in different simulations.49–51 The inverse correlation between the experimentally-derived Γ2,neighbor/Γ2,distant ratio and q is consistent with the larger simulation-derived Γ2,neighbor/Γ2,distant ratios for transmembrane vs. membrane surface location of the Fp, and the likely larger Fp lipid-contacting area and q value for the surface location.49,51 In addition, large Γ2,neighbor/Γ2,distant is observed in a different simulation in which the effective q ≈ 1 because of the strong correlation between protrusion and a hydrogen bond between one the four N-terminal residues of the Fp and a lipid phosphate oxygen, with consequent headgroup intrusion into the membrane interior.50
Besides the aforementioned simulation observations that increased chain protrusion may be associated with Fp/phosphate hydrogen bonding and headgroup intrusion, protrusion may also be augmented by solvation of lipid chains by hydrophobic Fp sidechains at the membrane surface. This could be part of the basis for much greater Ha2-induced intervesicle lipid mixing at endosomal pH 5.0 vs. physiologic pH 7.4.15 This effect is observed with POPC vesicles for which there isn’t bulk Ha2/vesicle electrostatic energy. At both pH’s, Fp is a mixture of closed and semi-closed helical hairpin structures, and semi-closed has significantly greater hydrophobic surface area.48 There is higher semi-closed population at pH 5 vs. 7 and therefore larger Fp hydrophobic surface area.
Linewidth and * peak analysis also support protrusion.
For the 2,2’ and 3,3’ signals, there are larger Mn2+-associated increases in linewidth, Δ[Δν], for samples with vs. without Fp (Table 3). The difference is less apparent for two-site signals from 13C nuclei closer to the chain termini, and these observations correlate with the trend of Γ2,Fp – Γ2,NoFp (Fig. 8 and Table 2). For the two-site signals, Table 4 provides the inhomogenous contributions to linewidths, which are calculated by Δνinhom = Δν − (R2/π). Table 4 also provides for each signal the RMSD and average value calculated from the data of the four samples. The typical RMSD is ±2 Hz and the average values are in the 26–37 Hz range. For our spectra, the individual contributions to the signal from each site are typically unresolved, except for 9,10 which has partially-resolved C9 and C10 contributions with respective higher and lower shifts. For earlier 13C NMR spectra of POPC with somewhat narrower linewidths than our spectra, there aren’t resolved shift differences (Δδ) between sites for the 2,2’, 16,14’, and 17,15’ signals, and the Δδ are ~0.09, 0.13, and 0.36 ppm for the 3,3’, 8,11, and 9,10 signals, respectively.62 For the present study, the 2,2’, 16,14’, and 17,15’ signals have Δνinhom ≈ 27 Hz which is likely due to 20 Hz exponential line broadening and shimming. There are larger Δνinhom of ~32 and 37 Hz for the 3,3’ and 8,11 signals, respectively, and the ~5 and 10 Hz increases over the Δνinhom ≈ 27 Hz baseline value correlate semi-quantitatively with the Δδ values of ~9 and ~13 Hz, respectively. For the 9,10 signal, the Δνinhom ≈ 32 Hz is smaller than would be expected from the Δδ ≈ 36 Hz. This anomaly is likely a consequence of the larger C9 vs. C10 contribution to the 9,10 signal. There is greater 1H-13C cross-polarization for C9 vs. C10 because of the smaller vs. larger site mobility that was previously described by differences in site order parameters.62
The * peak is a superposition of signals from eighteen 13C sites in the middle of the two chains, 4–7, 12–15, and 4’−13’. Table 2 lists the best-fit R2 and Γ2 values both for full integration of * intensities and for integration ranges denoted *1, *2, and *3 for which a subset of the 13C sites make the largest contributions, respectively 6’−9’; 7,10’,11’; and 4–6,12–15,4’,5’,12’,13’.62 The Γ2 values from the * fittings are similar to those of 8,11 and 9,10, and are intermediate between the larger 2,2’ and 3,3’ Γ2 values and smaller 16,14’ and 17,15’ values. The *1 and *2 integrations are dominated by signals from 13C sites closer to CO whereas the *3 integration has large contributions from 13C sites closer to the chain terminus. These different locations correlate with the Γ2,Fp > Γ2,NoFp for *1 and *2 and for 2,2’; 3,3’; 8,11; and 9,10 fittings, whereas Γ2,Fp ≈ Γ2,NoFp for *3; 16,14’; and 17,15’ fittings. The Mn2+-associated increases of the linewidths of the * peaks are similar to those of resolved 13C sites in the middle and terminal regions of the chains, and the increase for * is a little larger with vs. without Fp (Table 3). The * linewidth has substantial inhomogeneous contribution from the superposition of unresolved signals from many 13C sites.
Comparison between PRE and other experimental approaches to probe chain motions relevant to fusion.
The hypothesis of increased protrusion induced by Fp was initially proposed based on molecular dynamics simulations.49–51 The typical Ωprot,NoFp ≈ 0.01 and the Ωprot,Fp was larger but still < 0.2, i.e. protrusion was always a low-probability state. It is therefore anticipated that the observables from some experimental approaches have large contributions from the high-probability unprotruded chains. The Mn2+ paramagnetic relaxation enhancement (PRE) approach of the present study has the advantage that the Γ2 observable is dominated by the small population of protruded chains, based on: (1) Mn2+ is predominantly bound to the lipid headgroup phosphate; (2) the 〈r−6 〉 dependence of Γ2; and (3) the larger τc for protrusion vs. other chain motions.77 Some other approaches wouldn’t have this advantage. As one example, protrusion would also affect lipid 13C-31P dipolar coupling that can be measured by NMR.26 The coupling is proportional to 〈−3〉 where ρ is the internuclear distance. For the 2,2’ and 3,3’ sites, the 〈−3〉 for membrane without vs. with Fp are estimated to be ~2.01 × 10⁻³ vs. ~2.26 × 10⁻³ Å−3, i.e. only ~12% increase, as calculated from ρC-P,unprot ≈ 8 Å, ρC-P,unprot ≈ 5 Å, Ωprot,NoFp ≈ 0.01, and Ωprot,Fp ≈ 0.05. Another consideration is that investigation of protrusion by simulation has been done in fluid rather than gel membrane phases, in part because fluid phases are similar to those of membranes in viral fusion. Lipids in fluid phases experience rapid lateral diffusion and also other large-amplitude motions.68,77 These motions are usually advantageous for the PRE approach because they result in smaller R2’s that can generally be measured more accurately than larger R2’s. The motions also reduce dipolar couplings; however, the NMR spectra often have lower signal-to-noise when measuring smaller vs. larger couplings, so smaller couplings are less accurately-determined.78
Splay is the term used to describe the large-amplitude movement by the terminal region of the lipid chain into the headgroup region. Splay may be relevant to fusion and has been detected using the 1H-1H NOESY NMR cross-relaxation rate between the terminal methyl and the headgroup nuclei.65 The NOESY rates have been positively-correlated with the extents of fusion between vesicles with transmembrane peptides.79 However, these vesicle fusion rates are ~3 × 10⁻⁴ s−1 which are ~1000× smaller than rates of vesicle fusion induced by Fp’s.48 These results suggest that splay is a less important motion for fusion than the protrusion of chain -CH2 groups closest to the glycerol linkage, i.e. the motion probed in the present study. This conclusion is supported by the statement on p. 5 of Ref. 49, “…our simulations predict the effect on tail protrusion to be most profound in the upper region of the acyl chain, so a difference in tail exposure might be suboptimal probe for fusion peptide activity.”49
Conclusions
The present study presents convincing experimental data that support a large increase in lipid acyl chain protrusion caused by the membrane-bound Fp domain of the influenza virus Ha2 protein. Increased protrusion had previously been observed in computational simulations and may play an important role in fusion between the viral and the endosome membranes. In particular, protrusion may accelerate the transition from the initial separate apposed membranes to the stalk intermediate that connects and is contiguous with the outer leaflets of the two bodies. For the present study, protrusion was detected by larger Mn2+-associated increases in transverse relaxation rates of lipid chain 13C nuclei for samples with vs. without Fp. Analysis of the Γ2,Fp vs. Γ2,NoFp rate increases resulted in a calculated ratio Γ2,neighbor/Γ2,distant in the range of 4–24 where the ratio is for lipids neighboring vs. more distance from Fp. The ratio values within this range are inversely-correlated with the number of neighboring lipids. The experimental range is similar to the range in simulations for increased protrusion probability of a lipid neighboring vs. more distant from the Fp. For samples either with or without Fp, the Γ2 values are well-fitted by an exponential decay as the 13C site moves closer to the chain terminus. The decay correlates with a positive free-energy of protrusion that is proportional to the number of protruded -CH2 groups. The experimentally-determined free energy per -CH2 is ~0.25 kBT which matches the value in one of the simulations. Overall, the NMR data support one major fusion role of the Fp to be much greater chain protrusion with highest probability for chain regions closest to the headgroups.
Supplementary Material
Highlights.
NMR PRE shows 4–24 times higher chain protrusion probability for lipid next to Fp
Fp is 20-residue influenza virus hemagglutinin fusion peptide
Protrusion increase from Fp is greatest for chain -CH2 closest to lipid headgroup
Higher experimental protrusion probability matches MD simulations
More protrusion should increase rate of stalk formation in membrane fusion
Acknowledgements
This study was supported by the National Institutes of Health grant number R01 AI047153 and was carried out using equipment supported by the Max T. Rogers NMR facility, Mass Spectrometry facility, and Analytical/Physical laboratory which are all located at Michigan State University.
Abbreviations
- CP
cross-polarization
- Δδ
shift difference between sites of a two-site peak
- Δν
experimental FWHM linewidth
- Δνinhom
inhomogeneous contribution to linewidth
- Ed
ectodomain
- EPR
electron paramagnetic resonance
- FHa2
Ha2 ectodomain
- Fp
fusion peptide
- FsSu
spike fusion subunit protein
- FWHM
full-width at half-maximum
- Γ2
difference between R2 for samples with vs without Mn2+
- gp41
HIV FsSu protein
- Ha2
hemagglutinin protein subunit 2 (influenza virus FsSu)
- HIV
human immunodeficiency virus
- kB
Boltzmann’s constant
- MAS
magic angle spinning
- n
number of protruded -CH2 groups
- NMR
nuclear magnetic resonance
- Ntr
N-terminal region of FsSu
- PC:PG
POPC:POPG (4:1)
- ΩMn
probability that a protruded chain is near a Mn2+
- Ωprot
probability of lipid chain protrusion
- POPC
1-palmitoyl-2-oleoyl-phosphatidylcholine
- POPG
1-palmitoyl-2-oleoyl-phosphatidylglycerol
- PRE
paramagnetic relaxation enhancement
- q
number of lipid molecules next to Fp
- r
13C-Mn2+ distance
- R2
NMR transverse relaxation rate
- RbSu
spike receptor-binding subunit protein
- rf
radiofrequency
- S
integrated NMR peak intensity
- τ
dephasing time
Footnotes
Publisher's Disclaimer: This is a PDF file of an unedited manuscript that has been accepted for publication. As a service to our customers we are providing this early version of the manuscript. The manuscript will undergo copyediting, typesetting, and review of the resulting proof before it is published in its final form. Please note that during the production process errors may be discovered which could affect the content, and all legal disclaimers that apply to the journal pertain.
Supplementary Material for Publication
Electrospray ionization mass spectrum of Fp; *1, *2, and *3 peak integration ranges; Logarithmic plots and linear fittings; Tables of site-specific 13C R2’s and Γ2’s of acyl chains of POPC:POPG (4:1) membrane and their Mn2+ dependences; Tables of relaxation rates from replicate data
Declaration of interests
The authors declare that they have no known competing financial interests or personal relationships that could have appeared to influence the work reported in this paper.
References
- [1].White JM, Delos SE, Brecher M, and Schornberg K (2008) Structures and mechanisms of viral membrane fusion proteins: Multiple variations on a common theme, Crit. Rev. Biochem. Mol. Biol 43, 189–219. [DOI] [PMC free article] [PubMed] [Google Scholar]
- [2].Kielian M (2014) Mechanisms of virus membrane fusion proteins, Annual Rev. Virol 1, 171–189. [DOI] [PubMed] [Google Scholar]
- [3].Harrison SC (2015) Viral membrane fusion, Virology 479, 498–507. [DOI] [PMC free article] [PubMed] [Google Scholar]
- [4].Boonstra S, Blijleven JS, Roos WH, Onck PR, van der Giessen E, and van Oijen AM (2018) Hemagglutinin-mediated membrane fusion: A biophysical perspective, Ann. Revs. Biophys 47, 153–173. [DOI] [PubMed] [Google Scholar]
- [5].Tang T, Bidon M, Jaimes JA, Whittaker GR, and Daniel S (2020) Coronavirus membrane fusion mechanism offers a potential target for antiviral development, Antiviral Research 178, 104792. [DOI] [PMC free article] [PubMed] [Google Scholar]
- [6].Wilson IA, Skehel JJ, and Wiley DC (1981) Structure of the haemagglutinin membrane glycoprotein of influenza virus at 3 A resolution, Nature 289, 366–373. [DOI] [PubMed] [Google Scholar]
- [7].Pancera M, Zhou TQ, Druz A, Georgiev IS, Soto C, Gorman J, Huang JH, Acharya P, Chuang GY, Ofek G, Stewart-Jones GBE, Stuckey J, Bailer RT, Joyce MG, Louder MK, Tumba N, Yang YP, Zhang BS, Cohen MS, Haynes BF, Mascola JR, Morris L, Munro JB, Blanchard SC, Mothes W, Connors M, and Kwong PD (2014) Structure and immune recognition of trimeric pre-fusion HIV-1 Env, Nature 514, 455–461. [DOI] [PMC free article] [PubMed] [Google Scholar]
- [8].Ward AB, and Wilson IA (2017) The HIV-1 envelope glycoprotein structure: nailing down a moving target, Immunol. Revs 275, 21–32. [DOI] [PMC free article] [PubMed] [Google Scholar]
- [9].Kirchdoerfer RN, Cottrell CA, Wang NS, Pallesen J, Yassine HM, Turner HL, Corbett KS, Graham BS, McLellan JS, and Ward AB (2016) Pre-fusion structure of a human coronavirus spike protein, Nature 531, 118–121. [DOI] [PMC free article] [PubMed] [Google Scholar]
- [10].Wrapp D, Wang N, Corbett KS, Goldsmith JA, Hsieh C-L, Abiona O, Graham BS, and McLellan JS (2020) Cryo-EM structure of the 2019-nCoV spike in the prefusion conformation, Science 367, 1260–1263. [DOI] [PMC free article] [PubMed] [Google Scholar]
- [11].Chen J, Skehel JJ, and Wiley DC (1998) A polar octapeptide fused to the N-terminal fusion peptide solubilizes the influenza virus HA(2) subunit ectodomain, Biochemistry 37, 13643–13649. [DOI] [PubMed] [Google Scholar]
- [12].Lev N, Fridmann-Sirkis Y, Blank L, Bitler A, Epand RF, Epand RM, and Shai Y (2009) Conformational stability and membrane interaction of the full-length ectodomain of HIV-1 gp41: Implication for mode of action, Biochemistry 48, 3166–3175. [DOI] [PubMed] [Google Scholar]
- [13].Sackett K, Nethercott MJ, Epand RF, Epand RM, Kindra DR, Shai Y, and Weliky DP (2010) Comparative analysis of membrane-associated fusion peptide secondary structure and lipid mixing function of HIV gp41 constructs that model the early pre-hairpin intermediate and final hairpin conformations, J. Mol. Biol 397, 301–315. [DOI] [PMC free article] [PubMed] [Google Scholar]
- [14].Aydin H, Al-Khooly D, and Lee JE (2014) Influence of hydrophobic and electrostatic residues on SARS-coronavirus S2 protein stability: Insights into mechanisms of general viral fusion and inhibitor design, Prot. Sci 23, 603–617. [DOI] [PMC free article] [PubMed] [Google Scholar]
- [15].Ranaweera A, Ratnayake PU, and Weliky DP (2018) The stabilities of the soluble ectodomain and fusion peptide hairpins of the Influenza virus hemagglutinin subunit II protein are positively correlated with membrane fusion, Biochemistry 57, 5480–5493. [DOI] [PMC free article] [PubMed] [Google Scholar]
- [16].Caffrey M, Cai M, Kaufman J, Stahl SJ, Wingfield PT, Covell DG, Gronenborn AM, and Clore GM (1998) Three-dimensional solution structure of the 44 kDa ectodomain of SIV gp41, EMBO J. 17, 4572–4584. [DOI] [PMC free article] [PubMed] [Google Scholar]
- [17].Yang ZN, Mueser TC, Kaufman J, Stahl SJ, Wingfield PT, and Hyde CC (1999) The crystal structure of the SIV gp41 ectodomain at 1.47 A resolution, J. Struct. Biol 126, 131–144. [DOI] [PubMed] [Google Scholar]
- [18].Chen J, Skehel JJ, and Wiley DC (1999) N- and C-terminal residues combine in the fusion-pH influenza hemagglutinin HA2 subunit to form an N cap that terminates the triple-stranded coiled coil, Proc. Natl. Acad. Sci. U.S.A 96, 8967–8972. [DOI] [PMC free article] [PubMed] [Google Scholar]
- [19].Duquerroy S, Vigouroux AN, Rottier PJM, Rey FA, and Bosch BJ (2005) Central ions and lateral asparagine/glutamine zippers stabilize the post-fusion hairpin conformation of the SARS coronavirus spike glycoprotein, Virology 335, 276–285. [DOI] [PMC free article] [PubMed] [Google Scholar]
- [20].Walls AC, Tortorici MA, Snijder J, Xiong X, Bosch B-J, Rey FA, and Veesler D (2017) Tectonic conformational changes of a coronavirus spike glycoprotein promote membrane fusion, Proc. Natl. Acad. Sci. U.S.A 114, 11157–11162. [DOI] [PMC free article] [PubMed] [Google Scholar]
- [21].Chernomordik LV, and Kozlov MM (2008) Mechanics of membrane fusion, Nat. Struct. Mol. Biol 15, 675–683. [DOI] [PMC free article] [PubMed] [Google Scholar]
- [22].Blumenthal R, Durell S, and Viard M (2012) HIV entry and envelope glycoprotein-mediated fusion, J. Biol. Chem 287, 40841–40849. [DOI] [PMC free article] [PubMed] [Google Scholar]
- [23].Durrer P, Galli C, Hoenke S, Corti C, Gluck R, Vorherr T, and Brunner J (1996) H+-induced membrane insertion of influenza virus hemagglutinin involves the HA2 amino-terminal fusion peptide but not the coiled coil region, J. Biol. Chem 271, 13417–13421. [DOI] [PubMed] [Google Scholar]
- [24].Durell SR, Martin I, Ruysschaert JM, Shai Y, and Blumenthal R (1997) What studies of fusion peptides tell us about viral envelope glycoprotein-mediated membrane fusion, Mol. Membr. Biol 14, 97–112. [DOI] [PubMed] [Google Scholar]
- [25].Han X, and Tamm LK (2000) A host-guest system to study structure-function relationships of membrane fusion peptides, Proc. Natl. Acad. Sci. U.S.A 97, 13097–13102. [DOI] [PMC free article] [PubMed] [Google Scholar]
- [26].Jia LH, Liang S, Sackett K, Xie L, Ghosh U, and Weliky DP (2015) REDOR solid-state NMR as a probe of the membrane locations of membrane-associated peptides and proteins, J. Magn. Reson 253, 154–165. [DOI] [PMC free article] [PubMed] [Google Scholar]
- [27].Epand RM (2003) Fusion peptides and the mechanism of viral fusion, Biochim. Biophys. Acta 1614, 116–121. [DOI] [PubMed] [Google Scholar]
- [28].Ge M, and Freed JH (2009) Fusion peptide from influenza hemagglutinin increases membrane surface order: An electron-spin resonance study, Biophys. J 96, 4925–4934. [DOI] [PMC free article] [PubMed] [Google Scholar]
- [29].Gabrys CM, Yang R, Wasniewski CM, Yang J, Canlas CG, Qiang W, Sun Y, and Weliky DP (2010) Nuclear magnetic resonance evidence for retention of a lamellar membrane phase with curvature in the presence of large quantities of the HIV fusion peptide, Biochim. Biophys. Acta 1798, 194–201. [DOI] [PMC free article] [PubMed] [Google Scholar]
- [30].Tristram-Nagle S, Chan R, Kooijman E, Uppamoochikkal P, Qiang W, Weliky DP, and Nagle JF (2010) HIV fusion peptide penetrates, disorders, and softens T-cell membrane mimics, J. Mol. Biol 402, 139–153. [DOI] [PMC free article] [PubMed] [Google Scholar]
- [31].Yao HW, and Hong M (2013) Membrane-dependent conformation, dynamics, and lipid Interactions of the fusion peptide of the paramyxovirus PIV5 from solid-state NMR, J. Mol. Biol 425, 563–576. [DOI] [PMC free article] [PubMed] [Google Scholar]
- [32].Smrt ST, Draney AW, and Lorieau JL (2015) The influenza hemagglutinin fusion domain is an amphipathic helical hairpin that functions by inducing membrane curvature, J. Biol. Chem 290, 228–238. [DOI] [PMC free article] [PubMed] [Google Scholar]
- [33].Chakraborty H, Lentz BR, Kombrabail M, Krishnamoorthy G, and Chattopadhyay A (2017) Depth-dependent membrane ordering by Hemagglutinin fusion peptide promotes fusion, J. Phys. Chem. B 121, 1640–1648. [DOI] [PubMed] [Google Scholar]
- [34].Lai AL, and Freed JH (2014) HIV gp41 fusion peptide increases membrane ordering in a cholesterol-dependent fashion, Biophys. J 106, 172–181. [DOI] [PMC free article] [PubMed] [Google Scholar]
- [35].Lai AL, Millet JK, Daniel S, Freed JH, and Whittaker GR (2017) The SARS-CoV fusion peptide forms an extended bipartite fusion platform that perturbs membrane order in a calcium-dependent manner, J. Mol. Biol 429, 3875–3892. [DOI] [PMC free article] [PubMed] [Google Scholar]
- [36].Heller WT, and Zolnierczuk PA (2019) The helix-to-sheet transition of an HIV-1 fusion peptide derivative changes the mechanical properties of lipid bilayer membranes, Biochim. Biophys. Acta 1861, 565–572. [DOI] [PubMed] [Google Scholar]
- [37].Ghosh U, and Weliky DP (2020) 2H nuclear magnetic resonance spectroscopy supports larger amplitude fast motion and interference with lipid chain ordering for membrane that contains beta sheet human immunodeficiency virus gp41 fusion peptide or helical hairpin influenza virus hemagglutinin fusion peptide at fusogenic pH, Biochim. Biophys. Acta 1862, 183404. [DOI] [PMC free article] [PubMed] [Google Scholar]
- [38].Ghosh U, and Weliky DP (2021) Rapid 2H NMR transverse relaxation of perdeuterated lipid acyl chains of membrane with bound viral fusion peptide supports large-amplitude motions of these chains that can catalyze membrane fusion, Biochemistry 60, 2637–2651. [DOI] [PMC free article] [PubMed] [Google Scholar]
- [39].Freed EO, Delwart EL, Buchschacher GL Jr., and Panganiban AT (1992) A mutation in the human immunodeficiency virus type 1 transmembrane glycoprotein gp41 dominantly interferes with fusion and infectivity, Proc. Natl. Acad. Sci. U.S.A 89, 70–74. [DOI] [PMC free article] [PubMed] [Google Scholar]
- [40].Qiao H, Armstrong RT, Melikyan GB, Cohen FS, and White JM (1999) A specific point mutant at position 1 of the influenza hemagglutinin fusion peptide displays a hemifusion phenotype, Mol. Biol. Cell 10, 2759–2769. [DOI] [PMC free article] [PubMed] [Google Scholar]
- [41].Madu IG, Roth SL, Belouzard S, and Whittaker GR (2009) Characterization of a highly conserved domain within the Severe Acute Respiratory Syndrome coronavirus spike protein S2 domain with characteristics of a viral fusion peptide, J. Virol 83, 7411–7421. [DOI] [PMC free article] [PubMed] [Google Scholar]
- [42].Madu IG, Belouzard S, and Whittaker GR (2009) SARS-coronavirus spike S2 domain flanked by cysteine residues C822 and C833 is important for activation of membrane fusion, Virology 393, 265–271. [DOI] [PMC free article] [PubMed] [Google Scholar]
- [43].Rokonujjaman M, Sahyouni A, Wolfe R, Jia L, Ghosh U, and Weliky DP (2023) A large HIV gp41 construct with trimer-of-hairpins structure exhibits V2E mutation-dominant attenuation of vesicle fusion and helicity very similar to V2E attenuation of HIV fusion and infection and supports: (1) hairpin stabilization of membrane apposition with larger distance for V2E; and (2) V2E dominance by an antiparallel β sheet with interleaved fusion peptide strands from two gp41 trimers, Biophysical Chemistry 293, 106933. [DOI] [PMC free article] [PubMed] [Google Scholar]
- [44].Kim CS, Epand RF, Leikina E, Epand RM, and Chernomordik LV (2011) The final conformation of the complete ectodomain of the HA2 subunit of Influenza Hemagglutinin can by itself drive low pH-dependent fusion, J. Biol. Chem 286, 13226–13234. [DOI] [PMC free article] [PubMed] [Google Scholar]
- [45].Gallaher WR (1987) Detection of a fusion peptide sequence in the transmembrane protein of human immunodeficiency virus, Cell 50, 327–328. [DOI] [PubMed] [Google Scholar]
- [46].Nobusawa E, Aoyama T, Kato H, Suzuki Y, Tateno Y, and Nakajima K (1991) Comparison of complete amino acid sequences and receptor binding properties among 13 serotypes of hemagglutinins of influenza A viruses, Virology 182, 475–485. [DOI] [PubMed] [Google Scholar]
- [47].Lorieau JL, Louis JM, and Bax A (2010) The complete influenza hemagglutinin fusion domain adopts a tight helical hairpin arrangement at the lipid:water interface, Proc. Natl. Acad. Sci. U.S.A 107, 11341–11346. [DOI] [PMC free article] [PubMed] [Google Scholar]
- [48].Ghosh U, Xie L, Jia LH, Liang S, and Weliky DP (2015) Closed and semiclosed interhelical structures in membrane vs closed and open structures in detergent for the Influenza Virus hemagglutinin fusion peptide and correlation of hydrophobic surface area with fusion catalysis, J. Am. Chem. Soc 137, 7548–7551. [DOI] [PMC free article] [PubMed] [Google Scholar]
- [49].Larsson P, and Kasson PM (2013) Lipid tail protrusion in simulations predicts fusogenic activity of influenza fusion peptide mutants and conformational models, PLoS Comp. Biol 9, e1002950. [DOI] [PMC free article] [PubMed] [Google Scholar]
- [50].Legare S, and Lagguee P (2014) The influenza fusion peptide promotes lipid polar head intrusion through hydrogen bonding with phosphates and N-terminal membrane insertion depth, Proteins-Struc. Func. Bioinform 82, 2118–2127. [DOI] [PubMed] [Google Scholar]
- [51].Victor BL, Lousa D, Antunes JM, and Soares CM (2015) Self-assembly molecular dynamics simulations shed light into the interaction of the influenza fusion peptide with a membrane bilayer, J. Chem. Inform. Model 55, 795–805. [DOI] [PubMed] [Google Scholar]
- [52].Pabis A, Rawle RJ, and Kasson PM (2020) Influenza hemagglutinin drives viral entry via two sequential intramembrane mechanisms, Proc. Natl. Acad. Sci. U.S.A 117, 7200–7207. [DOI] [PMC free article] [PubMed] [Google Scholar]
- [53].Worch R, Krupa J, Filipek A, Szymaniec A, and Setny P (2017) Three conserved C-terminal residues of influenza fusion peptide alter its behavior at the membrane interface, Biochim. Biophys. Acta 1861, 97–105. [DOI] [PubMed] [Google Scholar]
- [54].Jaroniec CP, Kaufman JD, Stahl SJ, Viard M, Blumenthal R, Wingfield PT, and Bax A (2005) Structure and dynamics of micelle-associated human immunodeficiency virus gp41 fusion domain, Biochemistry 44, 16167–16180. [DOI] [PubMed] [Google Scholar]
- [55].Gabrys CM, and Weliky DP (2007) Chemical shift assignment and structural plasticity of a HIV fusion peptide derivative in dodecylphosphocholine micelles, Biochim. Biophys. Acta 1768, 3225–3234. [DOI] [PMC free article] [PubMed] [Google Scholar]
- [56].Qiang W, Bodner ML, and Weliky DP (2008) Solid-state NMR spectroscopy of human immunodeficiency virus fusion peptides associated with host-cell-like membranes: 2D correlation spectra and distance measurements support a fully extended conformation and models for specific antiparallel strand registries, J. Am. Chem. Soc 130, 5459–5471. [DOI] [PMC free article] [PubMed] [Google Scholar]
- [57].Schmick SD, and Weliky DP (2010) Major antiparallel and minor parallel beta sheet populations detected in the membrane-associated Human Immunodeficiency Virus fusion peptide, Biochemistry 49, 10623–10635. [DOI] [PMC free article] [PubMed] [Google Scholar]
- [58].Gabrys CM, Qiang W, Sun Y, Xie L, Schmick SD, and Weliky DP (2013) Solid-state nuclear magnetic resonance measurements of HIV fusion peptide 13CO to lipid 31P proximities support similar partially inserted membrane locations of the α Helical and β sheet peptide structures, J. Phys. Chem. A 117, 9848–9859. [DOI] [PMC free article] [PubMed] [Google Scholar]
- [59].Buffy JJ, Hong T, Yamaguchi S, Waring AJ, Lehrer RI, and Hong M (2003) Solid-state NMR investigation of the depth of insertion of protegrin-1 in lipid bilayers using paramagnetic Mn2+, Biophys. J 85, 2363–2373. [DOI] [PMC free article] [PubMed] [Google Scholar]
- [60].Su Y, Mani R, and Hong M (2008) Asymmetric insertion of membrane proteins in lipid bilayers by solid-state NMR paramagnetic relaxation enhancement: A cell-penetrating peptide example, J. Am. Chem. Soc 130, 8856–8864. [DOI] [PMC free article] [PubMed] [Google Scholar]
- [61].Clore GM, and Iwahara J (2009) Theory, practice, and applications of paramagnetic relaxation enhancement for the characterization of transient low-population states of biological macromolecules and their complexes, Chem. Rev 109, 4108–4139. [DOI] [PMC free article] [PubMed] [Google Scholar]
- [62].Ferreira TM, Coreta-Gomes F, Ollila OHS, Moreno MJ, Vaz WLC, and Topgaard D (2013) Cholesterol and POPC segmental order parameters in lipid membranes: solid state 1H-13C NMR and MD simulation studies, Phys. Chem. Chem. Phys 15, 1976–1989. [DOI] [PubMed] [Google Scholar]
- [63].Schaefer J, and Stejskal EO (1976) Carbon-13 nuclear magnetic resonance of polymers spinning at magic angle, J. Am. Chem. Soc 98, 1031–1032. [Google Scholar]
- [64].Metz G, Ziliox M, and Smith SO (1996) Towards quantitative CP-MAS NMR, Solid State Nucl. Mag. Reson 7, 155–160. [DOI] [PubMed] [Google Scholar]
- [65].Huster D, Arnold K, and Gawrisch K (1999) Investigation of lipid organization in biological membranes by two-dimensional nuclear Overhauser enhancement spectroscopy, J. Phys. Chem. B 103, 243–251. [Google Scholar]
- [66].Veatch SL, Soubias O, Keller SL, and Gawrisch K (2007) Critical fluctuations in domain-forming lipid mixtures, Proc. Natl. Acad Sci. U.S.A 104, 17650–17655. [DOI] [PMC free article] [PubMed] [Google Scholar]
- [67].Vaz WLC, Clegg RM, and Hallmann D (1985) Translational diffusion of lipids in liquid-crystalline phase phophatidylcholine bilayers. A comparison of experiment with theory, Biochemistry 24, 781–786. [DOI] [PubMed] [Google Scholar]
- [68].Oradd G, and Lindblom G (2004) NMR studies of lipid lateral diffusion in the DMPC/gramicidin D/water system: Peptide aggregation and obstruction effects, Biophys. J 87, 980–987. [DOI] [PMC free article] [PubMed] [Google Scholar]
- [69].Lindblom G, and Oradd G (2009) Lipid lateral diffusion and membrane heterogeneity, Biochim. Biophys. Acta 1788, 234–244. [DOI] [PubMed] [Google Scholar]
- [70].Yang J, Parkanzky PD, Bodner ML, Duskin CG, and Weliky DP (2002) Application of REDOR subtraction for filtered MAS observation of labeled backbone carbons of membrane-bound fusion peptides, J. Magn. Reson 159, 101–110. [DOI] [PubMed] [Google Scholar]
- [71].Wasniewski CM, Parkanzky PD, Bodner ML, and Weliky DP (2004) Solid-state nuclear magnetic resonance studies of HIV and influenza fusion peptide orientations in membrane bilayers using stacked glass plate samples, Chem. Phys. Lipids 132, 89–100. [DOI] [PubMed] [Google Scholar]
- [72].Sun Y (2009) Secondary structure and membrane insertion of the membrane-associated Influenza fusion peptide probed by solid-state nuclear magnetic resonance, Ph. D. Thesis, Michigan State University, East Lansing, MI, USA. [Google Scholar]
- [73].Janosi L, and Gorfe AA (2010) Simulating POPC and POPC/POPG bilayers: Conserved packing and altered surface reactivity, J. Chem. Theory Comput 6, 3267–3273. [DOI] [PubMed] [Google Scholar]
- [74].Golovina EA, Golovin AV, Hoekstra FA, and Faller R (2009) Water replacement hypothesis in atomic detailFactors determining the structure of dehydrated bilayer stacks, Biophys. J 97, 490–499. [DOI] [PMC free article] [PubMed] [Google Scholar]
- [75].Chang DK, Cheng SF, Lin CH, Kantchev EAB, and Wu CW (2005) Self-association of glutamic acid-rich fusion peptide analogs of influenza hemagglutinin in the membrane-mimic environments: Effects of positional difference of glutamic acids on side chain ionization constant and intra- and inter-peptide interactions deduced from NMR and gel electrophoresis measurements, Biochim. Biophys. Acta 1712, 37–51. [DOI] [PubMed] [Google Scholar]
- [76].Meier P, Ohmes E, and Kothe G (1986) Multipulse dynamic nuclear magnetic resonance of phospholipid membranes, J. Chem. Phys 85, 3598–3614. [Google Scholar]
- [77].Prosser RS, Davis JH, Mayer C, Weisz K, and Kothe G (1992) Deuterium NMR relaxation studies of peptide-lipid interactions, Biochemistry 31, 9355–9363. [DOI] [PubMed] [Google Scholar]
- [78].Bodner ML, Gabrys CM, Parkanzky PD, Yang J, Duskin CA, and Weliky DP (2004) Temperature dependence and resonance assignment of 13C NMR spectra of selectively and uniformly labeled fusion peptides associated with membranes, Magn. Reson. Chem 42, 187–194. [DOI] [PubMed] [Google Scholar]
- [79].Scheidt HA, Kolocaj K, Kristensen JV, Huster D, and Langosch D (2018) Transmembrane helix induces membrane fusion through lipid binding and splay, J. Phys. Chem. Lett 9, 3181–3186. [DOI] [PubMed] [Google Scholar]
Associated Data
This section collects any data citations, data availability statements, or supplementary materials included in this article.