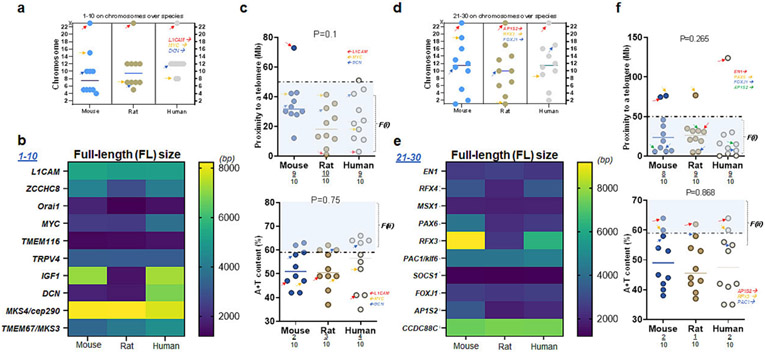
Figure 3. L1CAM and AP1S2: their proximity to telomeres and A+T content.
(a) Locations of ten genes associated with CH over three species of mice, rats, and humans. Note that L1CAM is located on the X chromosomes of all three species (b) The full-length (FL) size of ten genes (transcripts) over three species. Note that L1CAM, TMEM116, and TRPV4 show consistent molecular sizes in three species while other genes differ in humans as compared to rodents (c) Proximity to telomeres of ten genes over three species. Note that ten human genes investigated in this list (1-10) have evolved in a way meeting proximity to telomeres or the first factor, F(i), associated with high mutation rate as 9 of 10 human genes have proximity to telomeres at less than 50 Mb as compared to those of mice and rats (upper plot). A + T content of ten genes over three species demonstrate 2-4 of 10 genes meeting the second factor, F(ii), associated with high mutation rate (lower plot). Arrows in red, orange, and blue indicate L1CAM, MYC, and DCN, respectively (scatter plots in c). (d) Locations of the next ten genes associated with CH over three species of mice, rats, and humans. Note also that AP1S2 is located on the X chromosome of all three species (e) The FL size of ten genes over three species. Note that EN1, MSX1, PAC1, SOCS1, FOXJ1, and CCDC88CL1CAM show consistent molecular sizes in three species while four other genes differ in humans as compared to rodents (f) Proximity to telomeres of another ten genes over three species. Note that the majority of ten human genes investigated in this list (21-30) have evolved in a way meeting proximity to telomeres or the first factor, F(i), associated with high mutation rate as 8-9 of 10 human genes have proximity to telomeres at <50 Mb as compared to those of mice and rats (upper plot). A + T content of ten genes over three species demonstrate 1-2 of 10 genes meeting F(ii) associated with high mutation rate (lower plot). Arrows in red, orange, blue, and green indicate EN1, PAX6, FOXJ1, and AP1S2, respectively (Upper plot in c); arrows in red, orange, and blue indicate AP1S2, RFX3, and PAC1, respectively (Lower plot in c).

