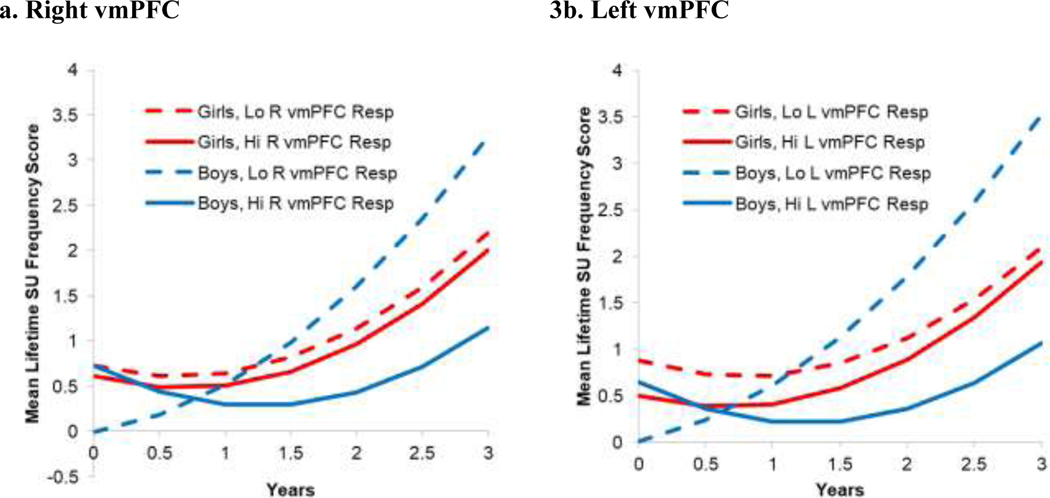
Figure 3.
Interaction Growth Curve Plots for Right and Left vmPFC Responses to Reward by Sex Predicting Increases in Substance Use Frequency from Baseline through 3 Year Follow-up, for Users
Note. Lo = low; Hi = high; R = right; L = left; vmPFC = ventromedial prefrontal cortex; Resp=response; SU = substance use. SU frequency is based on YRBS scoring bands (0 = 0 days, 1 = 1–2 days, 3 = 3–9 days, 4 = 20–39 days, 5 = 40 or more days), summed across substances. This analysis is with youth with reward task data who used substances (n = 41). The lines indicate mean growth for boys and girls with high (1 SD above the mean) or low (1 SD below the mean) in vmPFC responses.

