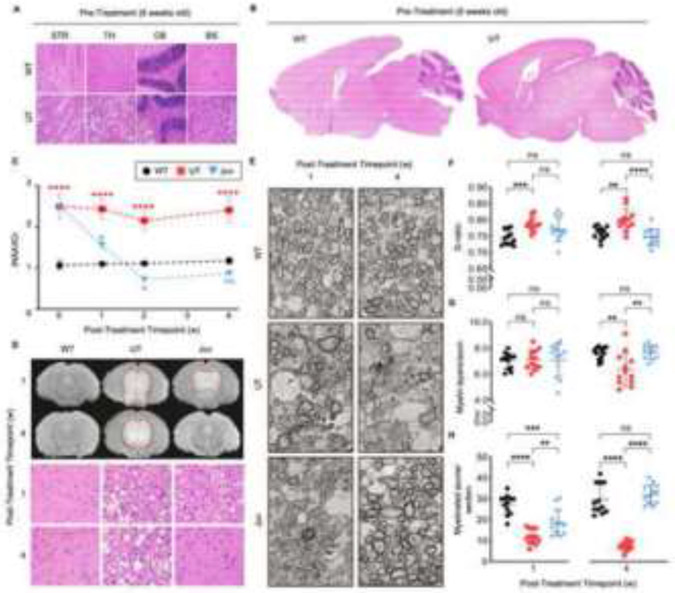
Figure 2: Serial magnetic resonance spectroscopy (MRS) and imaging (MRI), electron microscopy (EM), and H&E demonstrate reversal of CNS pathology in juvenile group.
H&E images of (A) region-specific and (B) global differences at pre-injection timepoint (6 weeks old) between WT and UT groups. (C) Serial MRS of total N-acetylaspartate (NAA)/total creatine (tCr) ratio from 6 weeks of age (day of injection, week 0) and subsequently 1, 2, and 4 weeks post-injection; 7, 8, and 10 weeks of age respectively (n=3 per group and timepoint). (D) Midbrain T2 MRI sequence (hyper-intensive areas marked by dashed red line) and H&E images of thalamic regions and (E) EM at 2600x magnification depicting axons and myelination of anterior commissure corresponding to 1- and 4- weeks post-ASPA re-expression. Quantification of myelin and axon properties in the anterior commissure including (F) the G-ratio, (G) the number of myelin layers per axon, and (H) the number of myelinated axons per imaged section at 1- and 4- weeks post-ASPA re-expression. Two-way ANOVA with multi-comparison correction, mean ±SD, ns = not significant, * p<0.05; ** p<0.01, *** p<0.001, **** p<0.0001.

