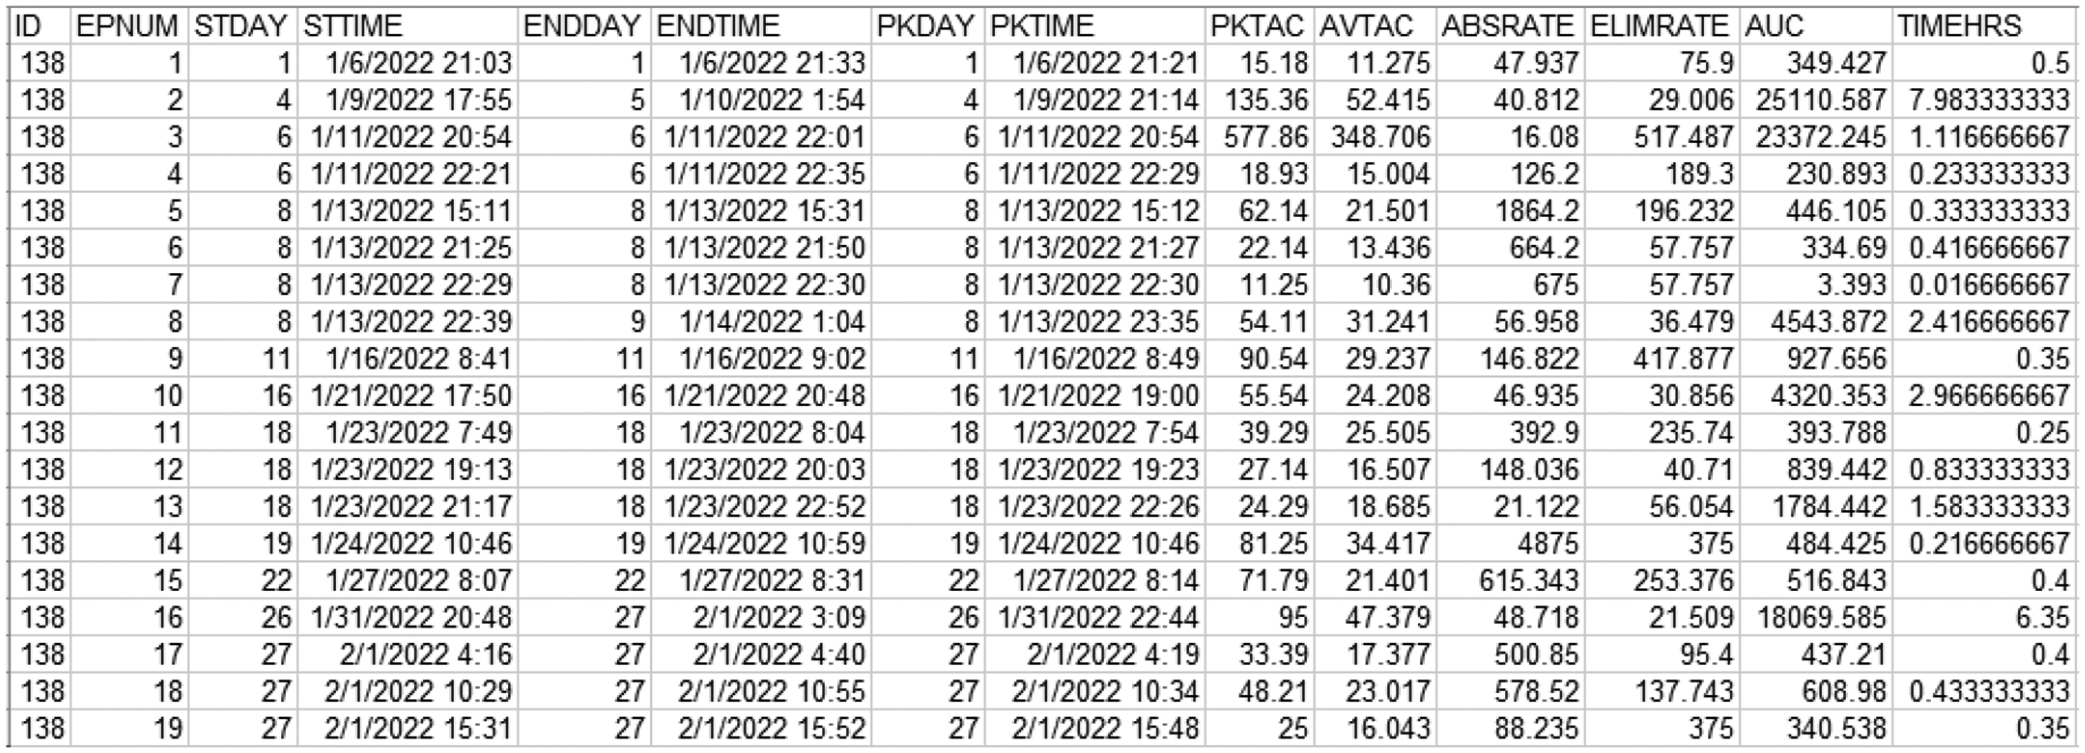
Figure 1B:

Episode-level data for one participant with 19 drinking episodes across 27 data collection days
Note. Example screenshot of dataset derived from TASMAC where data are displayed at the episode-level (defined by user-identified drinking criteria). EPNUM = sequentially numbered episode, STDAY = sequential day number of episode start, STTIME = timestamp of episode start, ENDDAY = sequential day number of episode end, ENDTIME = timestamp of episode end, PKDAY =sequential day number of episode peak TAC value, PKTIME = time of episode peak TAC value, PKTAC = Peak TAC (μg/L)of the episode, AVTAC = avg TAC (μg/L)of episode, ABSRATE = episode absorption rate, ELIMRATE = episode elimination rate, AUC = episode area-under-the-curve, TIMEHRS = elapsed episode time (hrs). TAC values displayed here include raw data (PKTAC) and untransformed calculations from raw data (AVTAC) and may include extreme TAC values derived from potential environmental exposures (i.e., not necessarily reflecting consumed alcohol).
