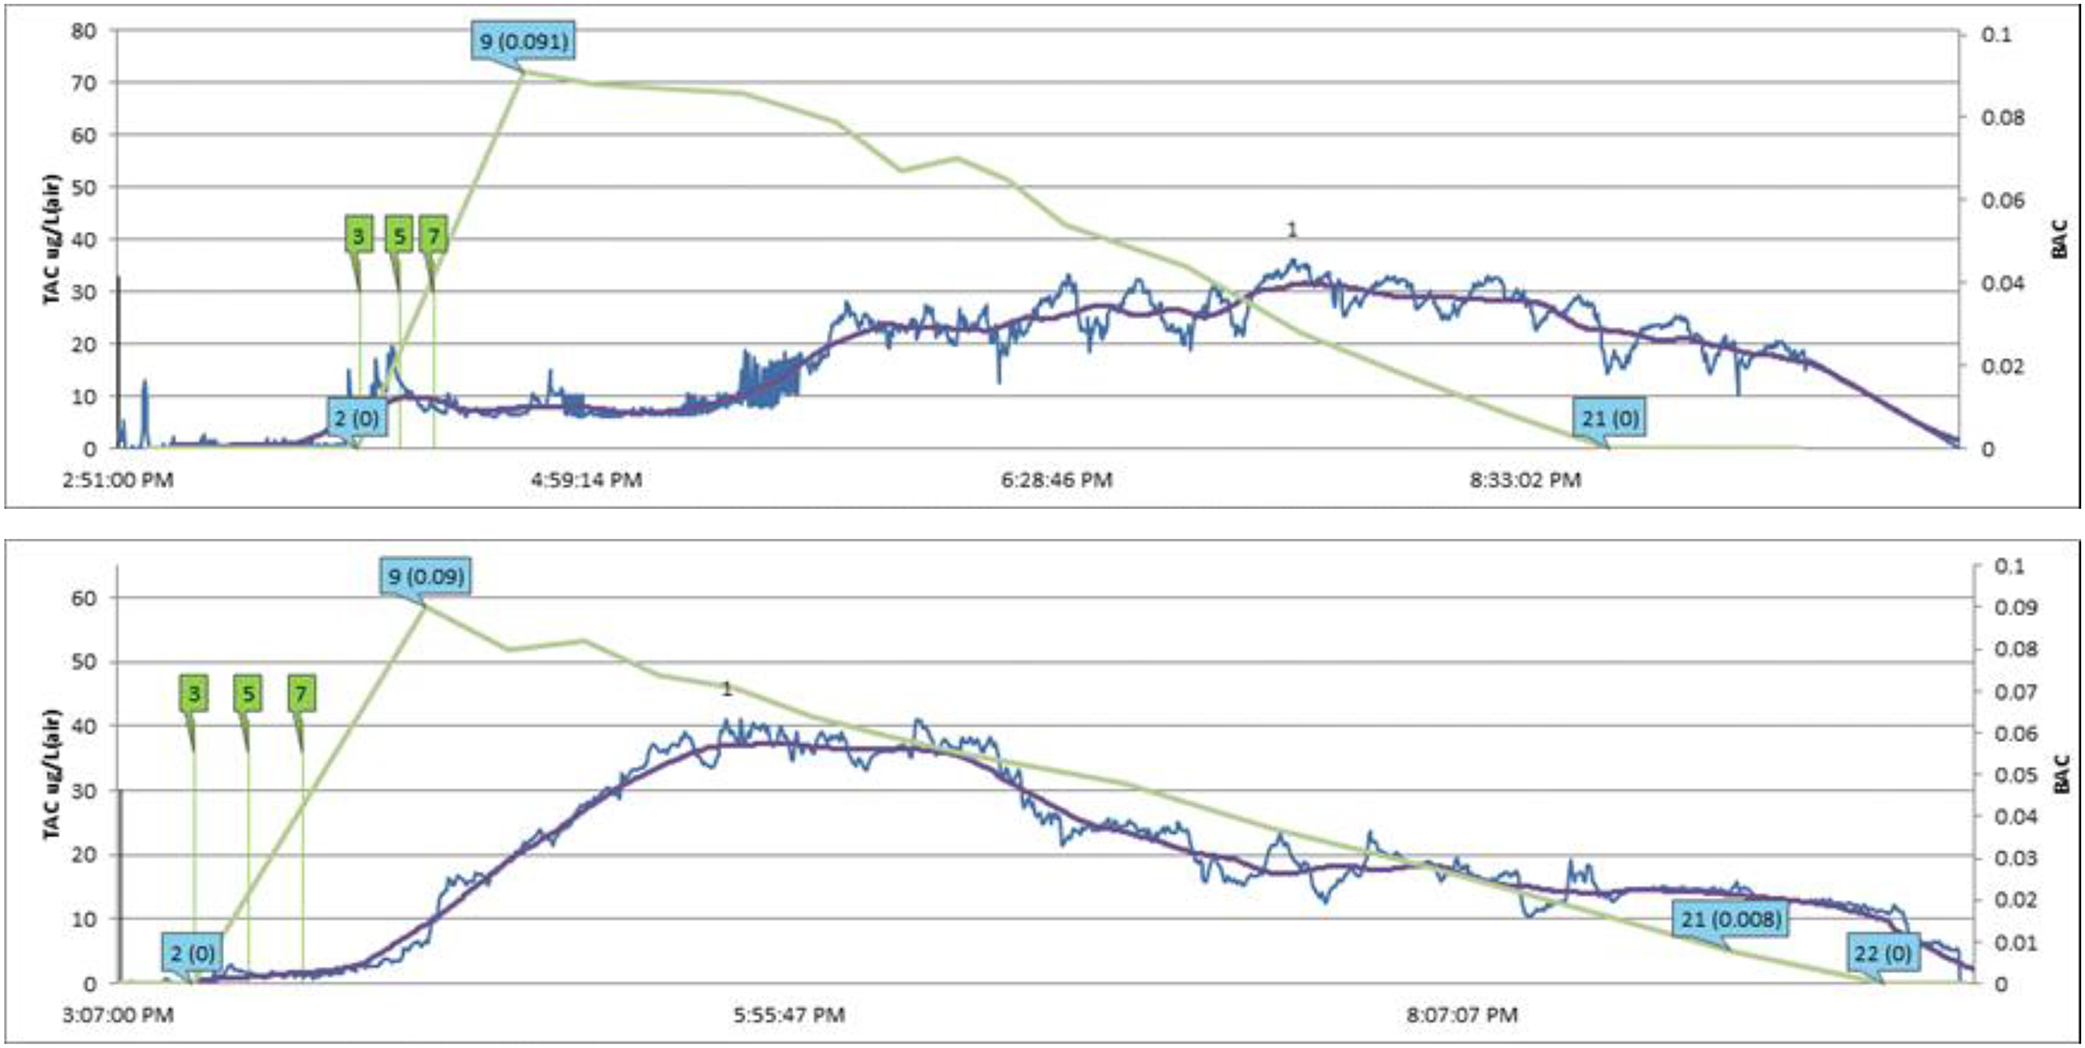
Figure 3.


Example of TAC plots derived from TASMAC 2.0.
Note. Graphs produced with TASMAC and display raw TAC values (blue), TAC as centered running averages every 90 seconds (CAV 90, purple), laboratory measures BAC (green), observed drink start time (green vertical line) from three separate participants drinking within the same laboratory protocol.
