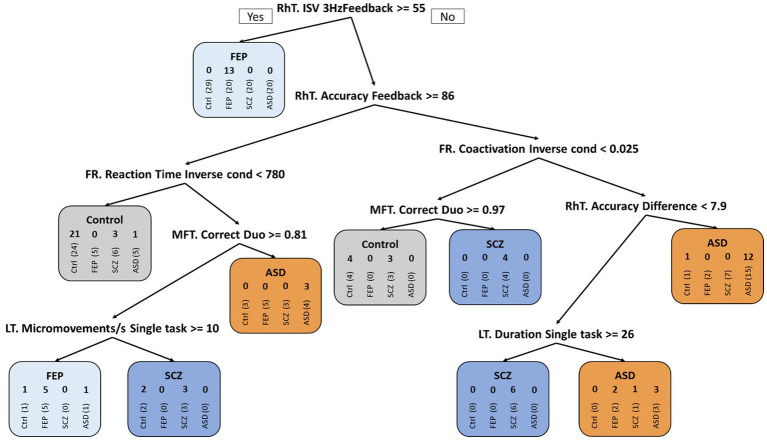
Figure 4.
CART decision tree. Classification of the four groups using CART decision tree algorithm: Control subjects, patients with First-Episode Psychosis (FEP), with Schizophrenia (SCZ), or with Autism Spectrum Disorder (ASD). The 4 successive numbers in the rounded rectangles represent: number of control subjects, of FEP, of SCZ and of ASD patients in a particular group; e.g., if RhT ISV 3 Hz Feedback > = 55 ms ➔ 0 13 0 0 in the FEP group after the first branch corresponds to: 0 (among 29) control subjects (vertical writing), 13 (among 20) FEP, 0 (among 20) SCZ and 0 (among 20) ASD patients were classified as FEP patients (and so on for the following branches). Over the entire tree, false detections thus concerned 4/29 controls, 2/20 FEP, 7/20 SCZ, and 2/20 ASD patients.

