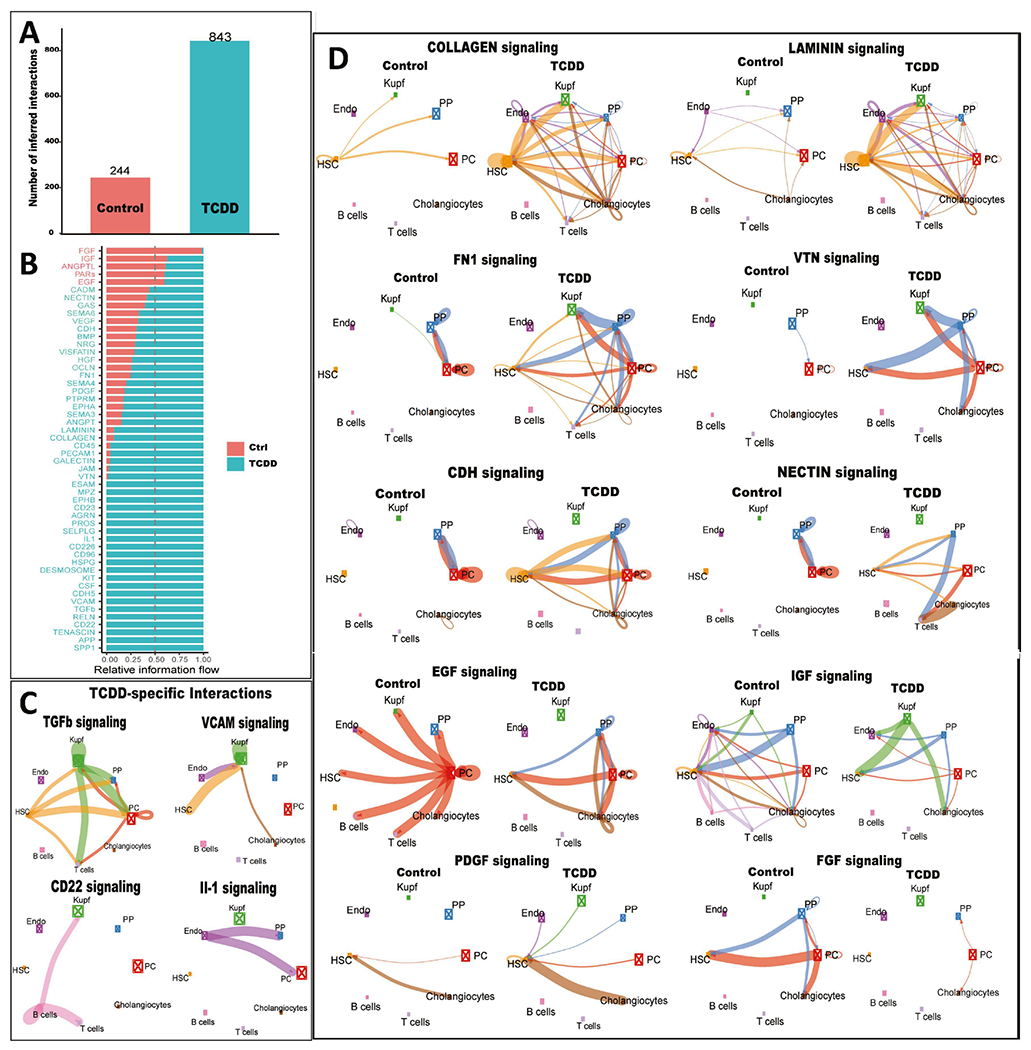
Fig. 5. TCDD-induced changes in intercellular communication within mouse liver.

A. Bar plot showing number of ligand-receptor interactions identified by CellChat in snRNA cell clusters from control and TCDD-exposed liver. B. Ligand-receptor interactions identified in each dataset are grouped into 52 signaling pathways. X-axis shows the relative information flow of each signaling pathway along the Y-axis, indicating intercellular signaling pathways whose activity increases or decreases between control and TCDD-exposed liver. C. Circle plots showing examples of TCDD-specific intercellular communication patterns. Edge weights are proportional to the interaction strength: a thicker edge line indicates a stronger signal, while sizes of the boxes with X in the center are proportional to the number of cells in each cell type. D. Circle plots showing examples of differential intercellular communication patterns between control and TCDD-exposed liver. Also see Table S4.
