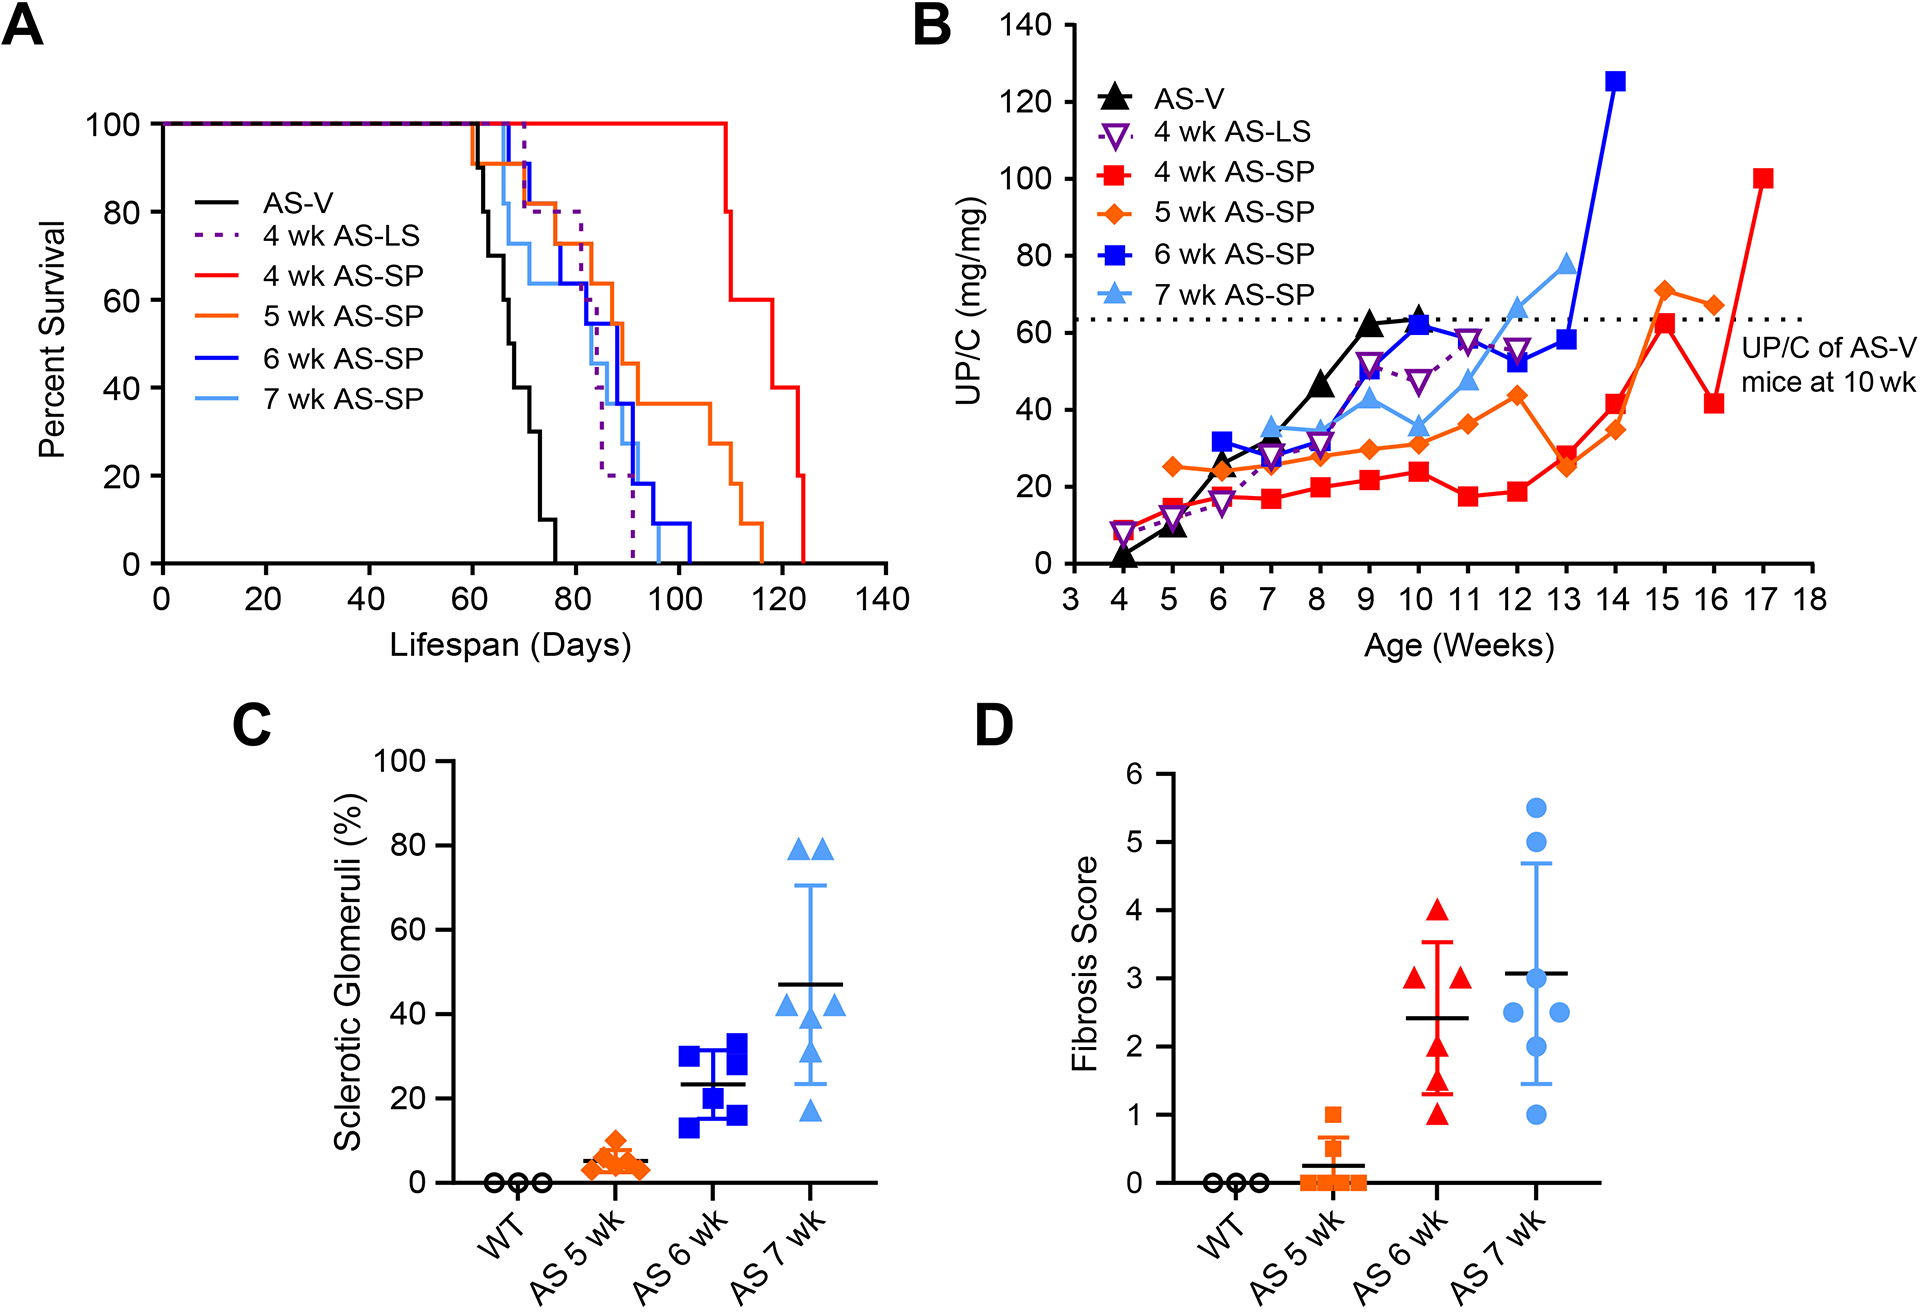
Figure 5. Sparsentan extended lifespan and delayed proteinuria even when treatment initiated in mice with developed renal structural changes.

Lifespan and UP/C of AS-V, AS-LS, or AS-SP mice treated from 4, 5, 6, or 7 wk of age, where renal structural changes and proteinuria were evident from 5 wk of age. (A) Kaplan–Meier plot showing the percent survival of AS-V, AS-LS, or AS-SP mice with treatment initiated at different ages. (B) Mean UP/C over the course of the lifespan study in mice shown in panel A. Dashed line indicates the mean UP/C of AS-V mice at 10 wk of age. (C) Sclerotic glomeruli fraction in untreated AS mice at 5, 6, and 7 wk of age (n=6, n=6, and n=7, respectively). (D) TIF in untreated AS mice at 5, 6, and 7 wk of age (n=6, n=6, and n=7, respectively). Dosing with study treatment AS-LS, 10 mg/kg; AS-SP, 120 mg/kg. The number of mice surviving at each week during the life-span studies is presented in supplementary material, Table S7.
