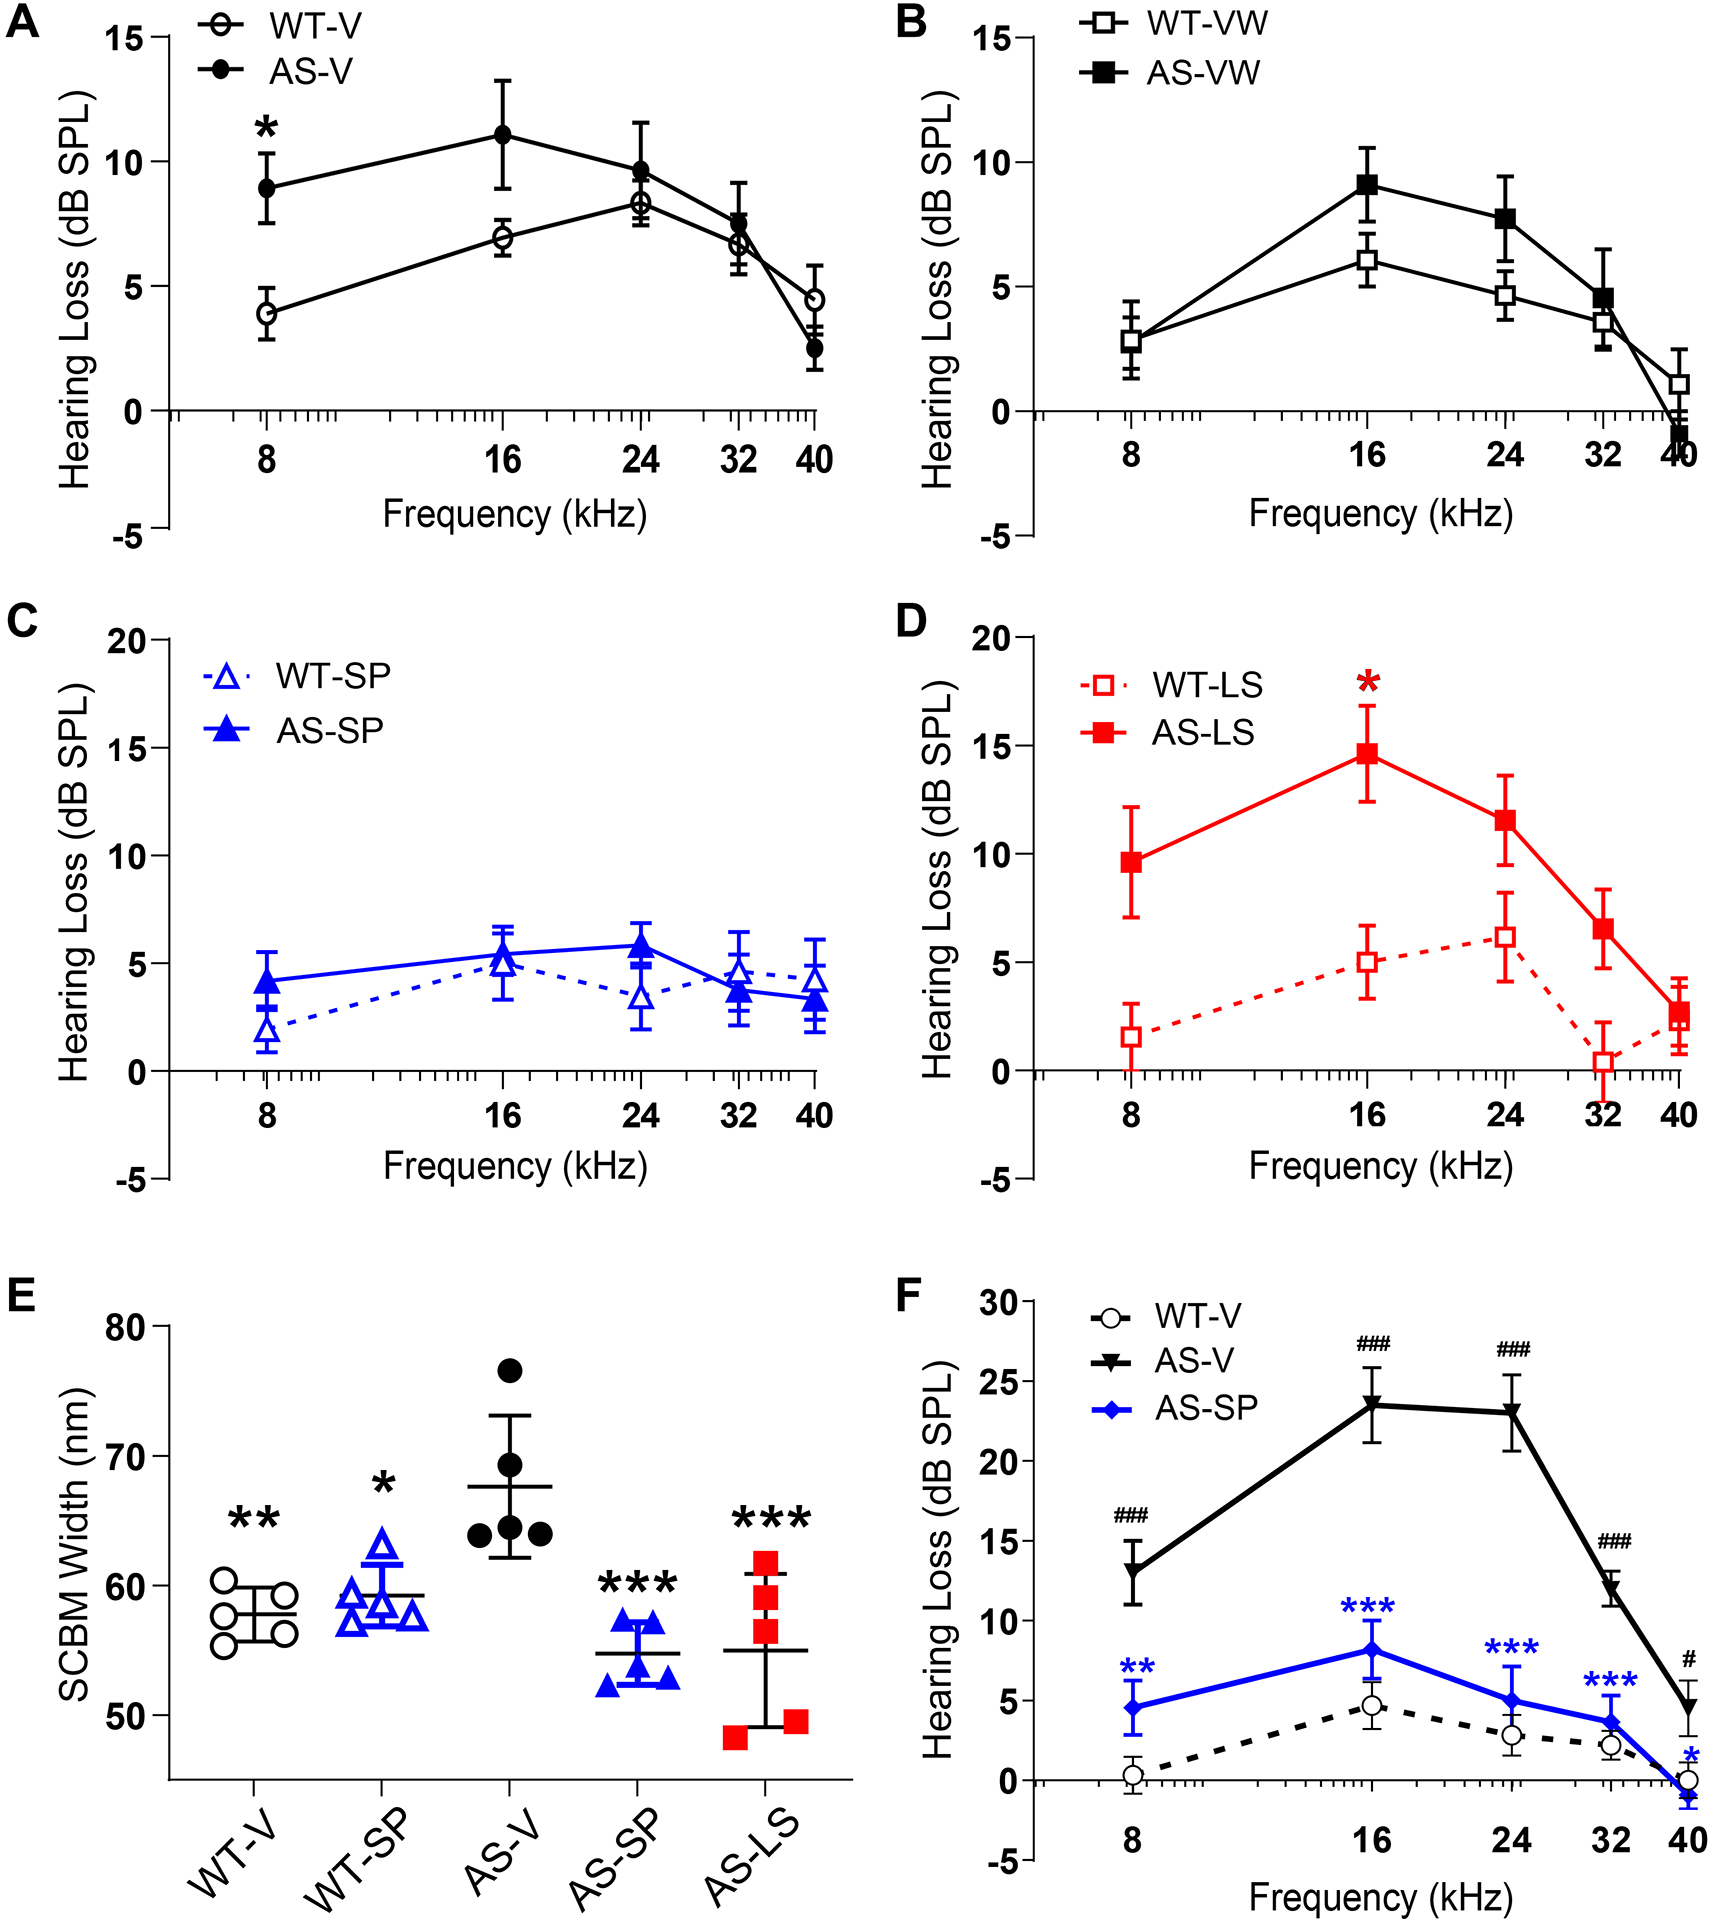
Figure 6. Sparsentan but not losartan protected against hearing loss in AS mice.

Hearing loss from a metabolic noise stress in AS or WT mice following treatment with vehicle, losartan, or sparsentan from 3–9 wk of age (EI) or 5–9 wk of age (LI; sparsentan only) was assessed by ABR measurements at frequencies of 8–40 kHz. AS-V (A) and AS-VW (B) were susceptible to the metabolically stressful noise as evidenced by hearing loss 5 days following exposure versus the recovery by WT-V or WT-VW mice, respectively (*P<0.05 for WT-V versus AS-V), (C) Recovery of hearing loss in AS-SP mice was equivalent to that of WT-SP mice, (D) Hearing loss in AS-LS mice was worse compared to AS-VW mice (*P<0.05 WT-LS versus AS-LS), (E) SCBM width in WT and AS mice treated with vehicle, SP, or LS from 3–9.5 wk of age in EI studies (n=5), determined from ultrastructural images obtained following excision of the cochlea after the post-noise ABR measurement. Both SP and LS significantly prevented the increase in SCBM width observed in AS-V mice. *P<0.05 for AS-V versus WT-SP; **P<0.01 for AS-V versus WT-V; ***P<0.001 for AS-V versus AS-SP or AS-LS. Notably, the average SCBM in the AS-LS mice had thinned to less than the normal basement membrane width of 50–60 nm, while the remaining three mice showed average SCBM widths consistent with those from WT-V mice. (F) Late treatment at 5–9 wk of age with sparsentan significantly attenuated susceptibility to hearing loss in AS mice compared to AS-V mice at all frequencies tested: WT-V, n=16; AS-V, n=10; AS-SP, n=11. ###P<0.001, #P<0.05 for AS-V versus WT-V; ***P<0.001, **P<0.01, *P<0.05 for AS-V versus AS-SP.
Data in (A–E) are shown as mean dB SPL±SEM. Data in (E) are shown for each stria as well as the group mean±SD (nm). Analysis (A–D and F) was performed using 2-way ANOVA followed by the Holm-Šídák multiple comparison test (GraphPad Prism). Analysis in (E) was performed using 1-way ANOVA and Tukey’s post-hoc multiple comparison test (GraphPad Prism).
