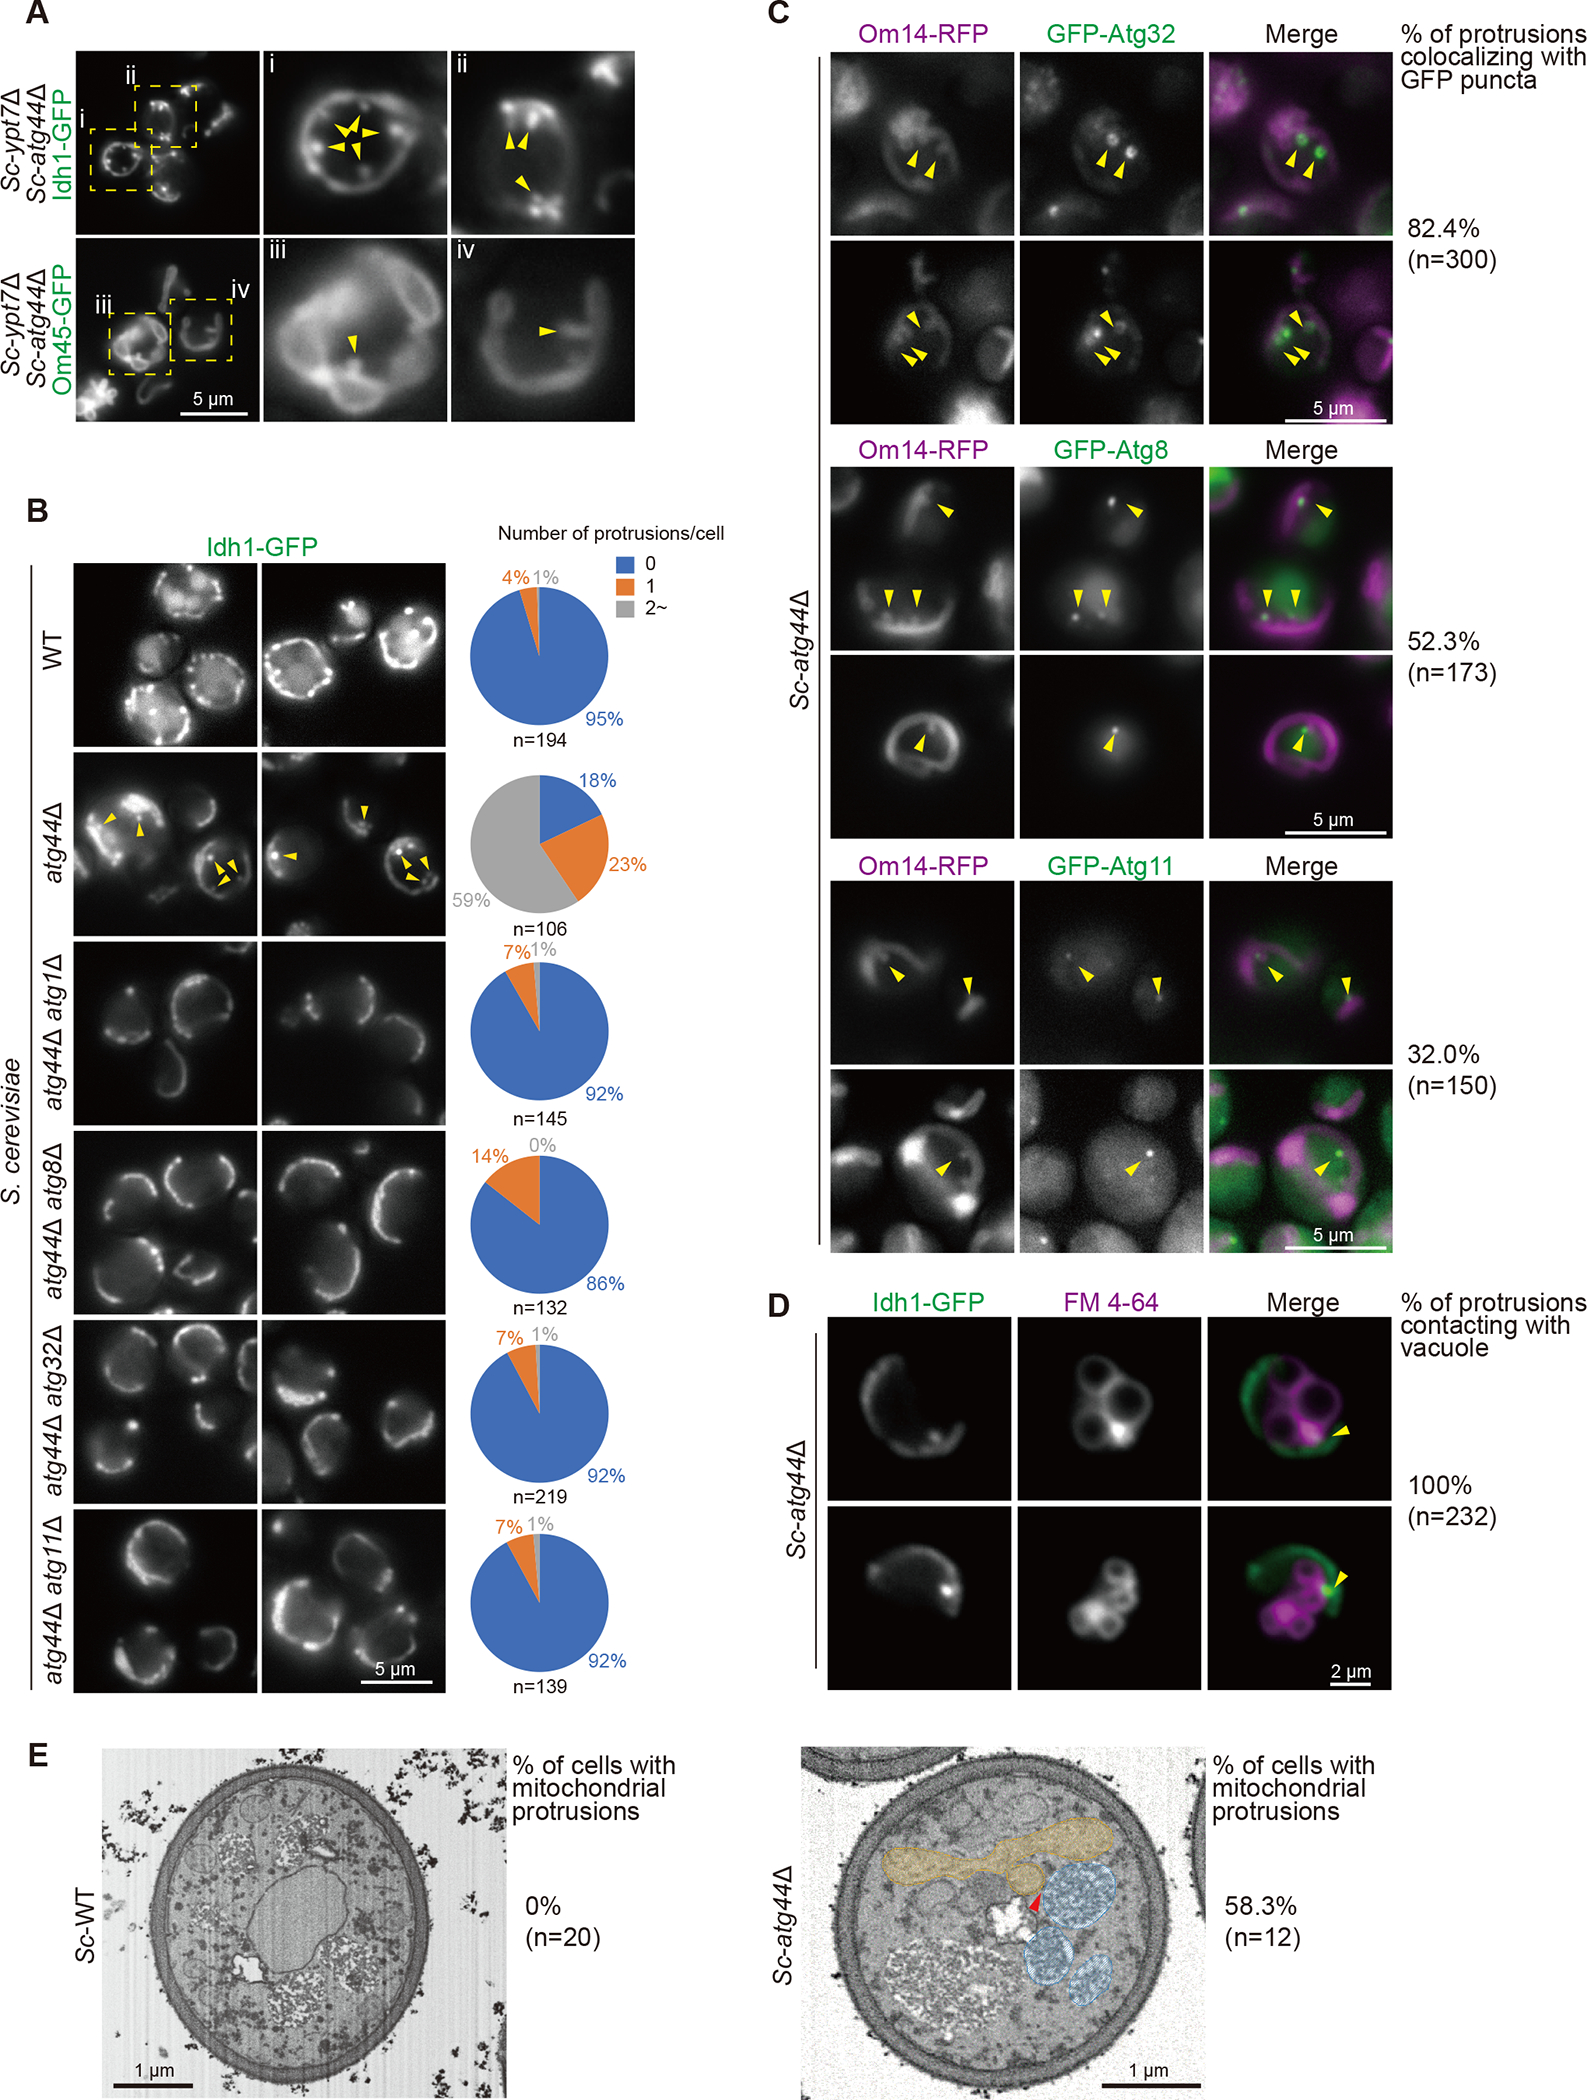
Figure 2. Mitochondrial protrusions were formed in atg44Δ cells upon mitophagy induction dependent on mitophagy factors.

(A and B) The indicated S. cerevisiae cells expressing a mitochondrial protein Idh1-GFP (A and B) or Om45-GFP (A) were grown in YPL and shifted to SD-N medium for 6 h and then analyzed by fluorescence microscopy. Arrowheads indicate mitochondrial protrusions. The number of mitochondrial protrusions per cell was counted (B).
(C) The indicated S. cerevisiae cells expressing a mitochondrial protein Om14-RFP and GFP-Atg32, GFP-Atg8, or GFP-Atg11 were grown in YPL and shifted to SD-N medium for 6 h and then analyzed by fluorescence microscopy. Arrowheads indicate accumulation of GFP-Atg32, GFP-Atg8, or GFP-Atg11 on the mitochondrial protrusions, and the percentage of their colocalization was quantified.
(D) S. cerevisiae atg44Δ cells expressing Idh1-GFP were grown in YPL and shifted to SD-N for 6 h in the presence of FM 4–64 and then analyzed by fluorescence microscopy. Arrowheads indicate the contact between a mitochondrial protrusion and the vacuole.
(E) S. cerevisiae WT and atg44Δ cells were grown in YPL and shifted to SD-N for 6 h. Cells were collected and processed for FIB-SEM. The arrowhead in atg44Δ cell indicates the tip of mitochondrial protrusion close to the vacuole. Yellow, mitochondria; blue, vacuole. See also Videos S1 and S2. The percentage of cells with mitochondrial protrusions is indicated.
The value of n represents the number of observed cells (B and E) and protrusions (C and D). Scale bars and their lengths are provided in each panel.
See also Figure S2.
