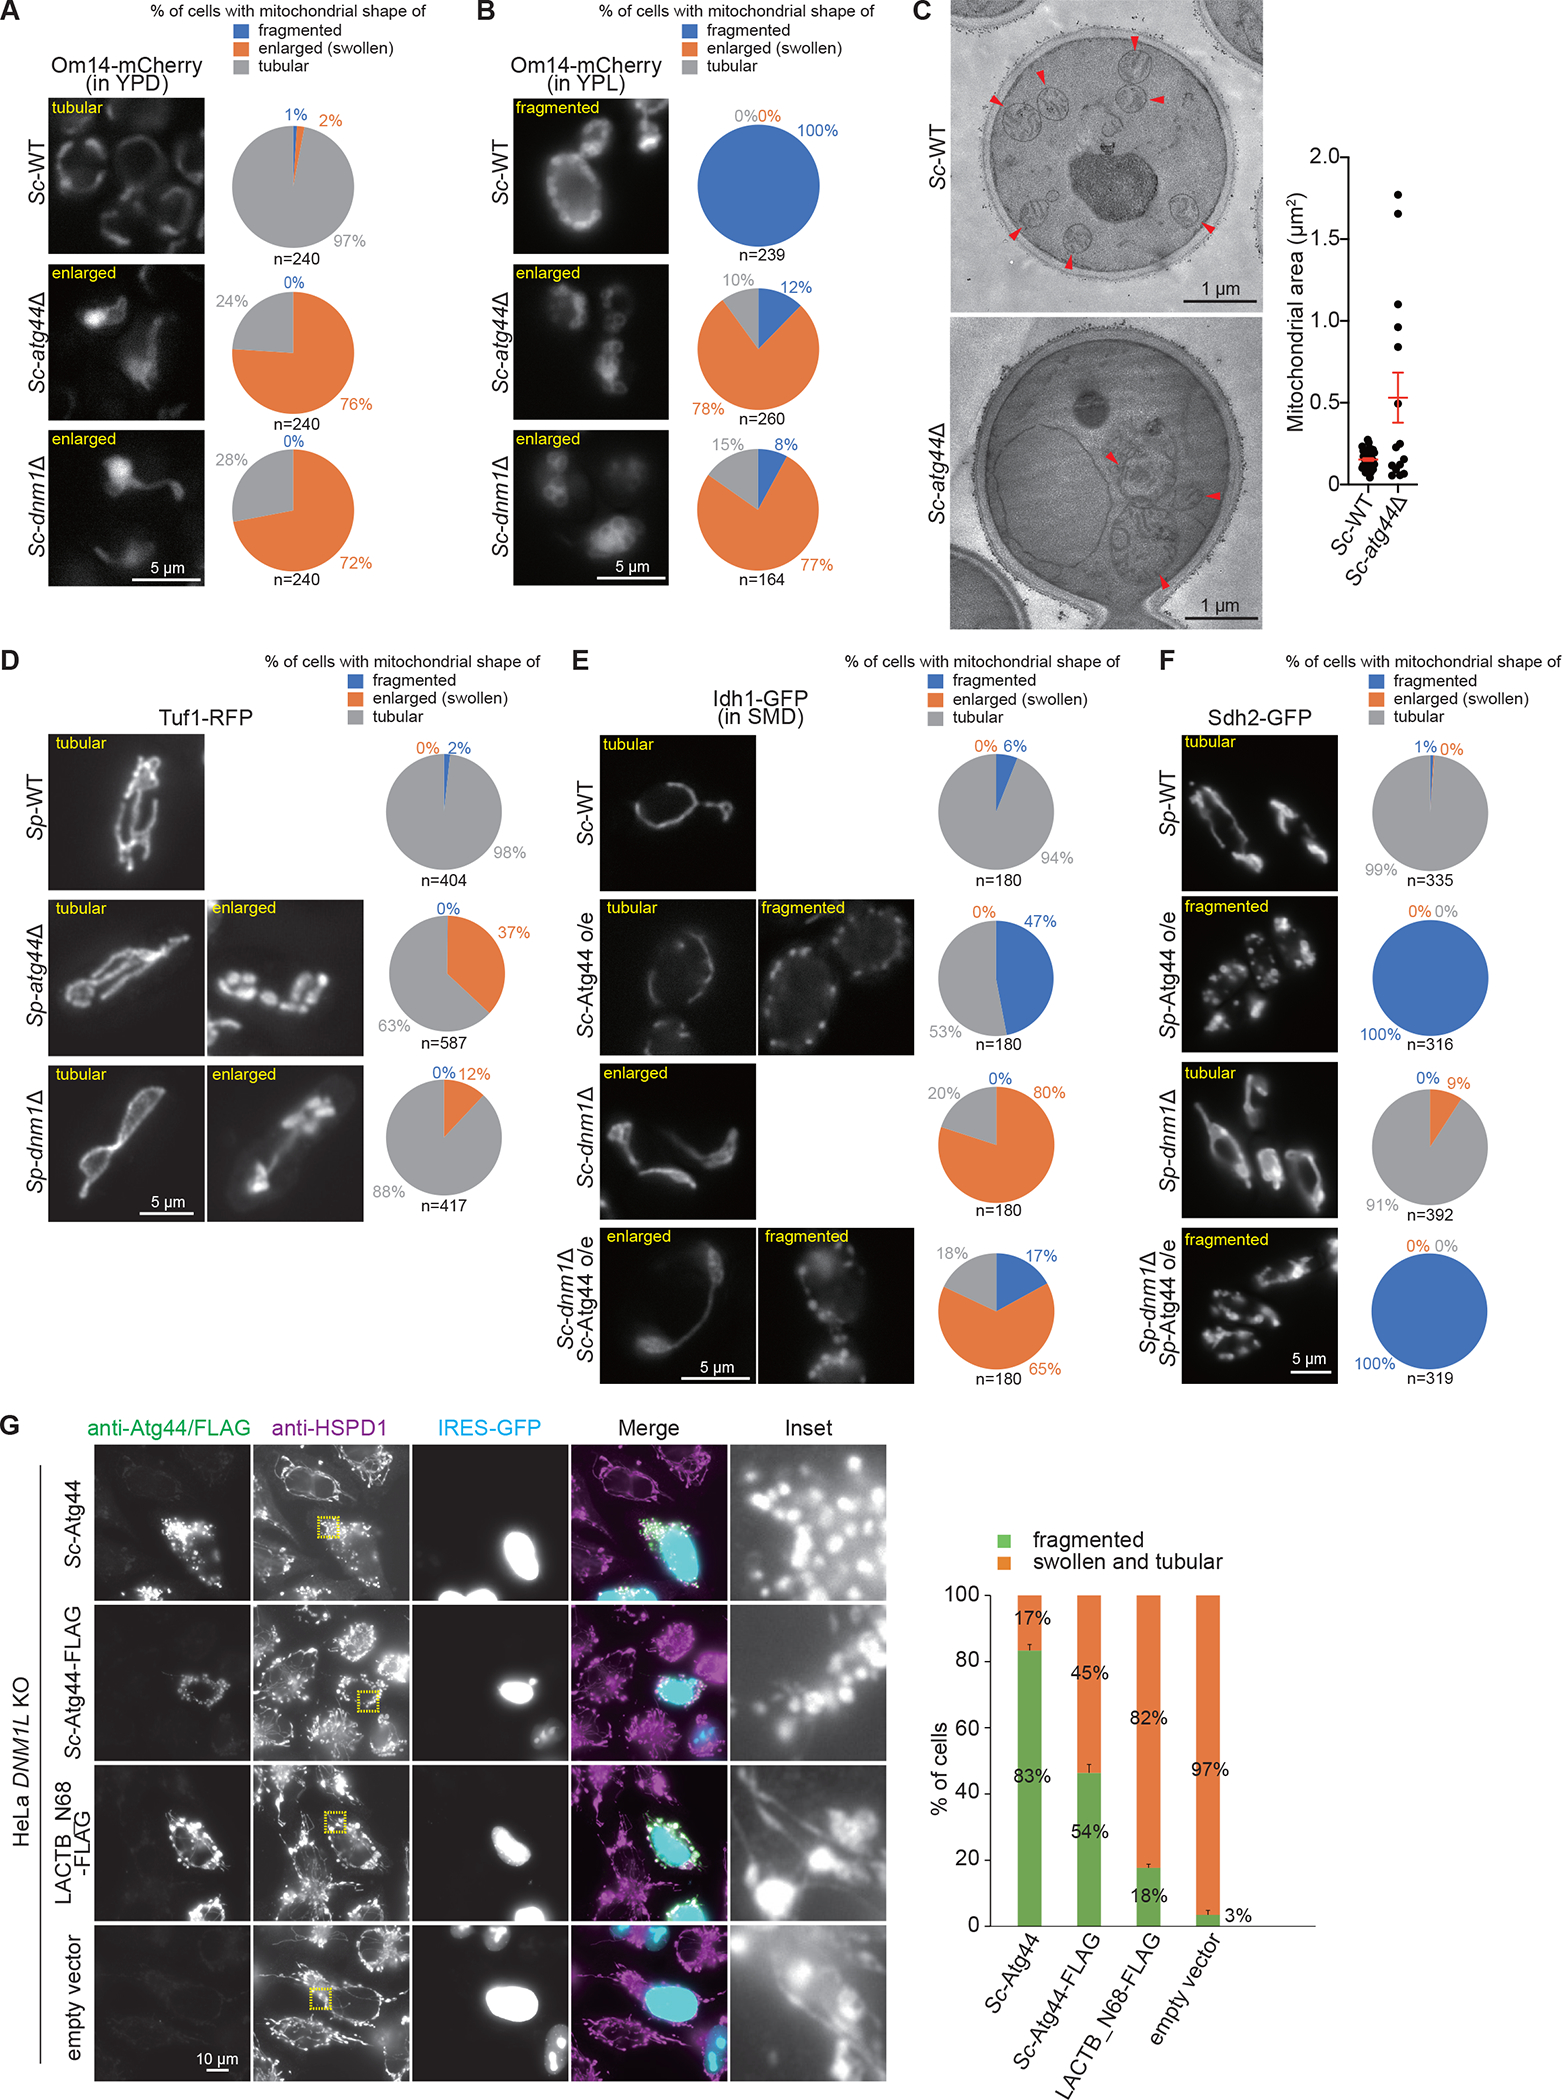
Figure 3. Atg44 has a role in mitochondrial fission.

(A, B, and D–F) The indicated S. cerevisiae cells expressing Om14-mCherry (A and B) or Idh1-GFP (E) were grown in YPD (A), YPL (B), or SMD-Ura (E) and S. pombe cells expressing Tuf1-RFP (D) or Sdh2-GFP (F) were grown in EMM, and analyzed by fluorescence microscopy. Cells were classified according to their mitochondrial morphology (fragmented, enlarged, tubular in shape), and their ratio was quantified. o/e, overexpression.
(C) The indicated S. cerevisiae cells were grown in YPL. Cells were collected and processed for transmission electron microscopy. Mitochondrial area was quantified and plotted. The error bars represent the mean ± SEM. Arrowheads indicate mitochondria. See also Videos S3 and S4.
(G) DNM1L/Drp1-knockout HeLa cells were transfected with the IRES-GFP-NLS vector to express Sc-Atg44, Sc-Atg44-FLAG, or LACTB_N68-FLAG. The expressed proteins and the mitochondrial morphology were analyzed by immunofluorescence microscopy using the anti-Sc-Atg44 (Sc-Atg44), anti-FLAG (Sc-Atg44-FLAG, LACTB_N68-FLAG, and empty vector), and anti-HSPD1/HSP60 antibodies. Fluorescence images were shown with a same image scaling. Nuclear GFP-expressing cells were classified according to whether their mitochondria were fragmented or swollen and tubular in shape, and their ratio was quantified. The results represent the mean and SD of three experiments. More than 65 cells were analyzed for each experiment.
The value of n represents the number of observed cells. Scale bars and their lengths are provided in each panel.
See also Figure S3.
