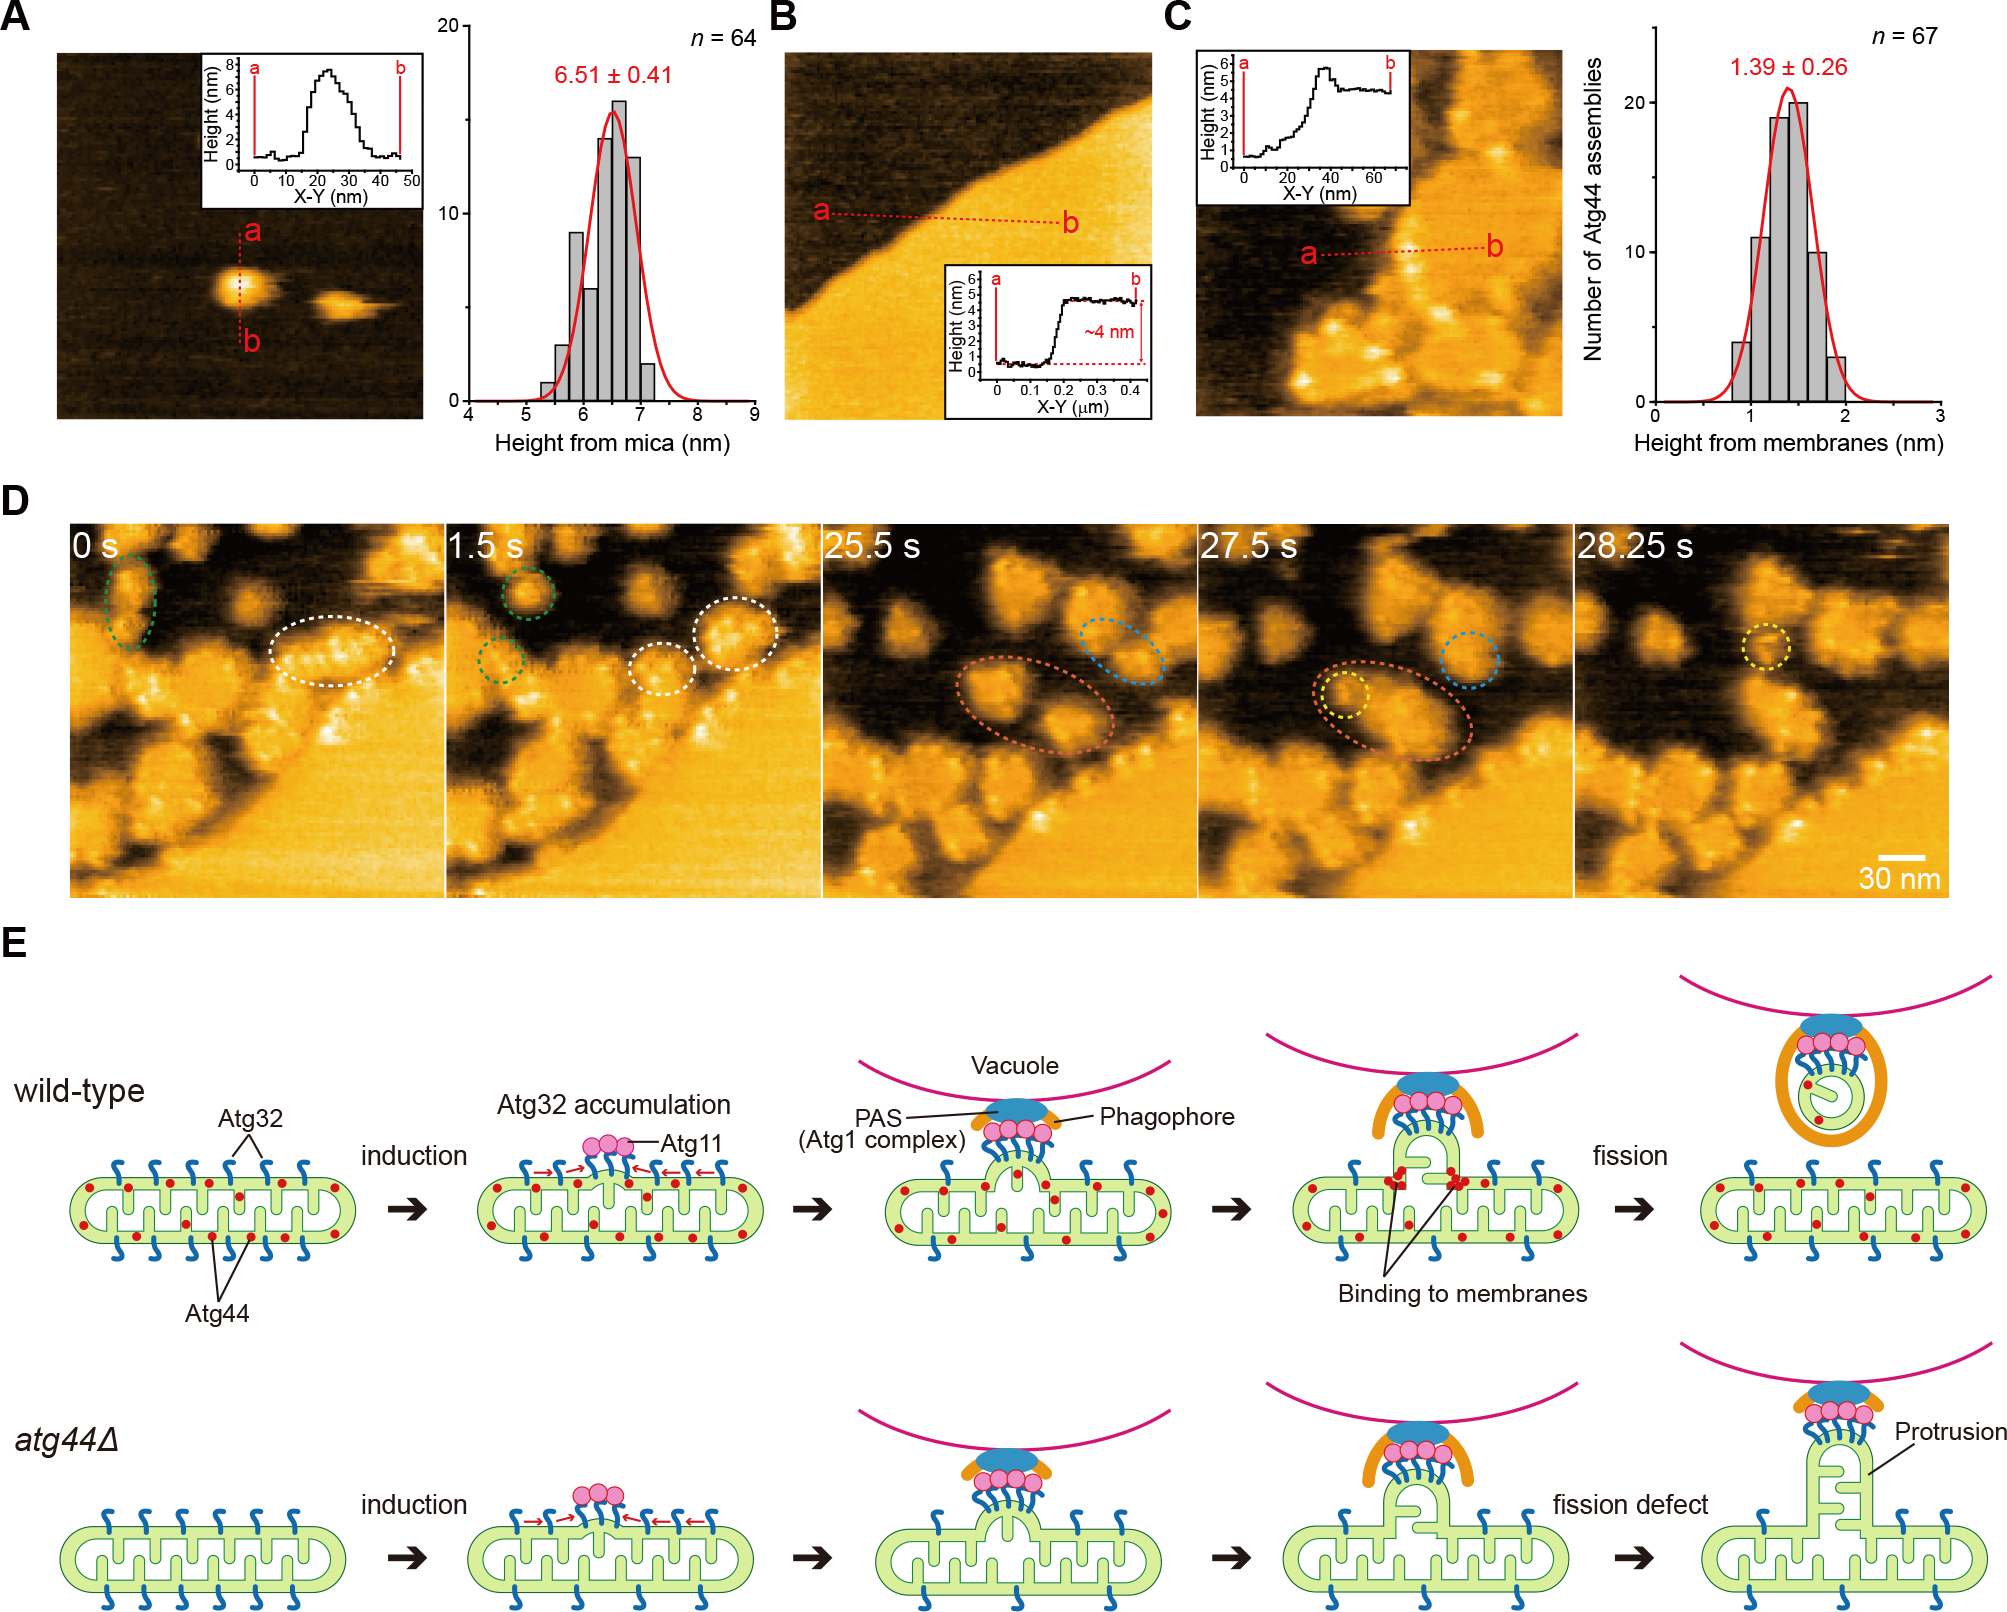
Figure 7. Atg44 binds to lipid-bilayer membranes and causes membrane fragility.

(A–C) HS-AFM images of Sp-Atg44 on the mica surface (A), the planar lipid bilayers covering mica (B), or Sp-Atg44 bound to the planar lipid bilayers (C). Inset shows height profile of the red line in each image. Histograms in (A) and (C) show the height distribution of Sp-Atg44 assemblies on the mica surface (n = 64) and membrane-bound Sp-Atg44 assemblies (n = 67), respectively.
(D) Successive HS-AFM images of division and fusion of the fragmented lipid bilayers by Sp-Atg44. Scale bar, 30 nm. See also Video S6.
(E) Schematic model of Atg44-dependent mitochondrial fission during mitophagy.
See also Figure S7.
