
Figure 7.
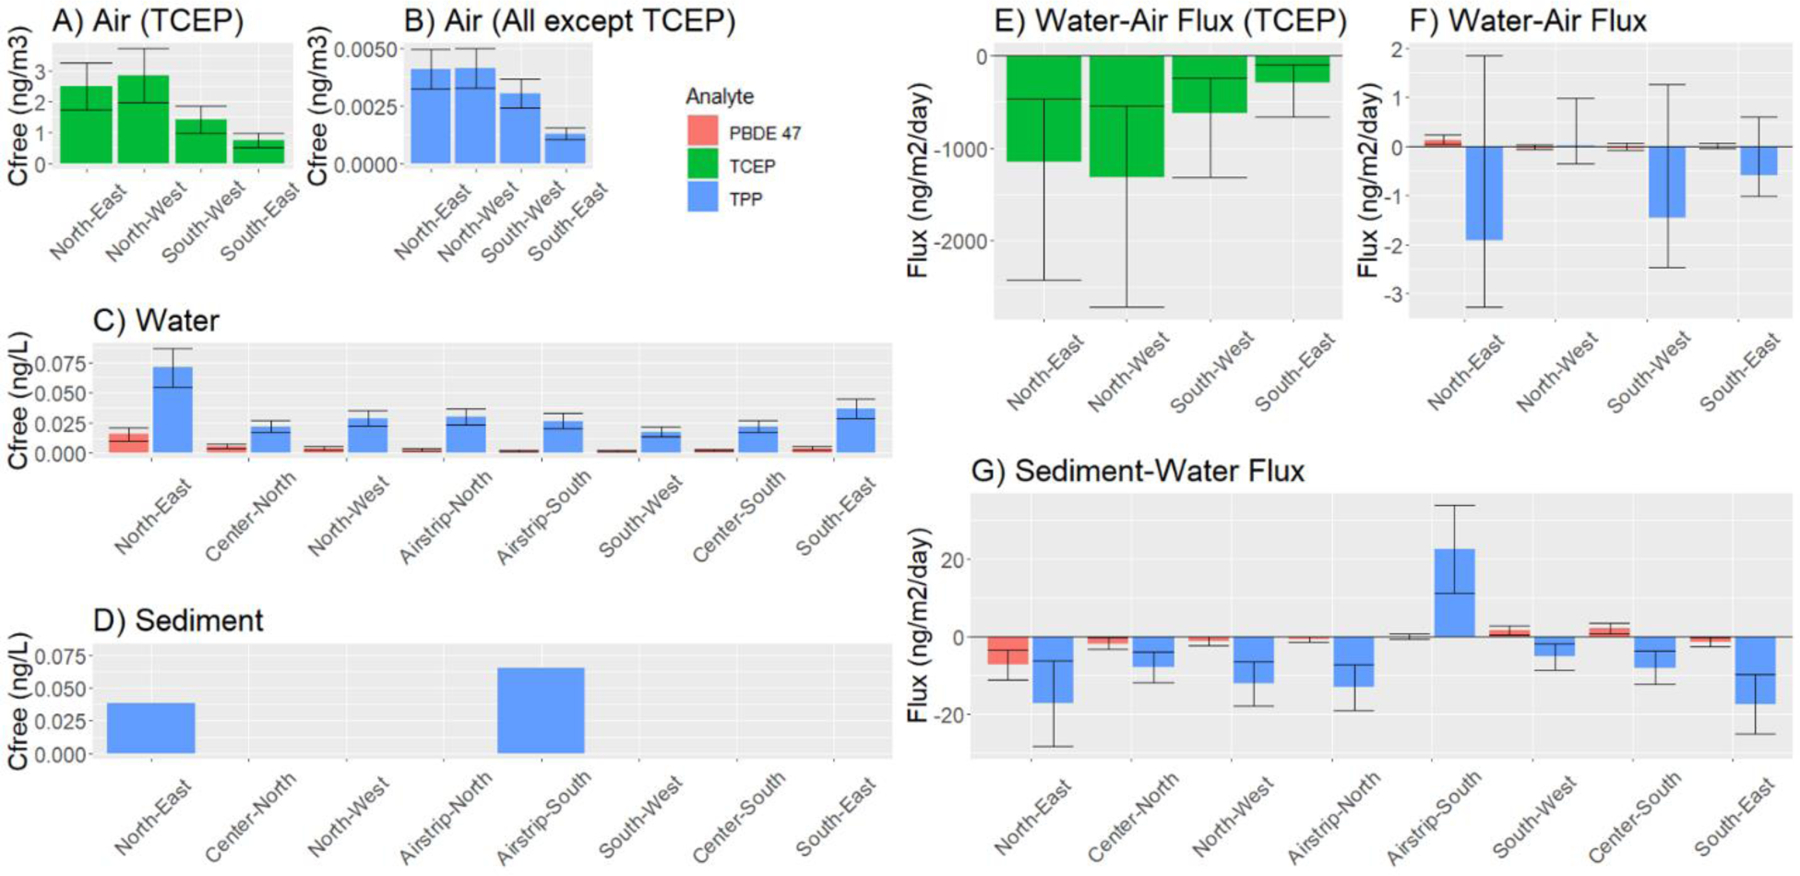
A though D depict freely dissolved concentrations of brominated and organophosphate flame retardants in the air (A and B), water (C) and sediment (D). Error bars represent standard deviation of triplicate field deployed samplers. The remaining panels represent diffusive fluxes of brominated and organophosphate flame retardants across the air-water (E and F) and sediment-water (G) interfaces. Error bars represent prediction intervals from Monte Carlo simulations corresponding to plus or minus one standard deviation (68%) accounting for replicate variability and uncertainty in model parameters as described in supplemental information.