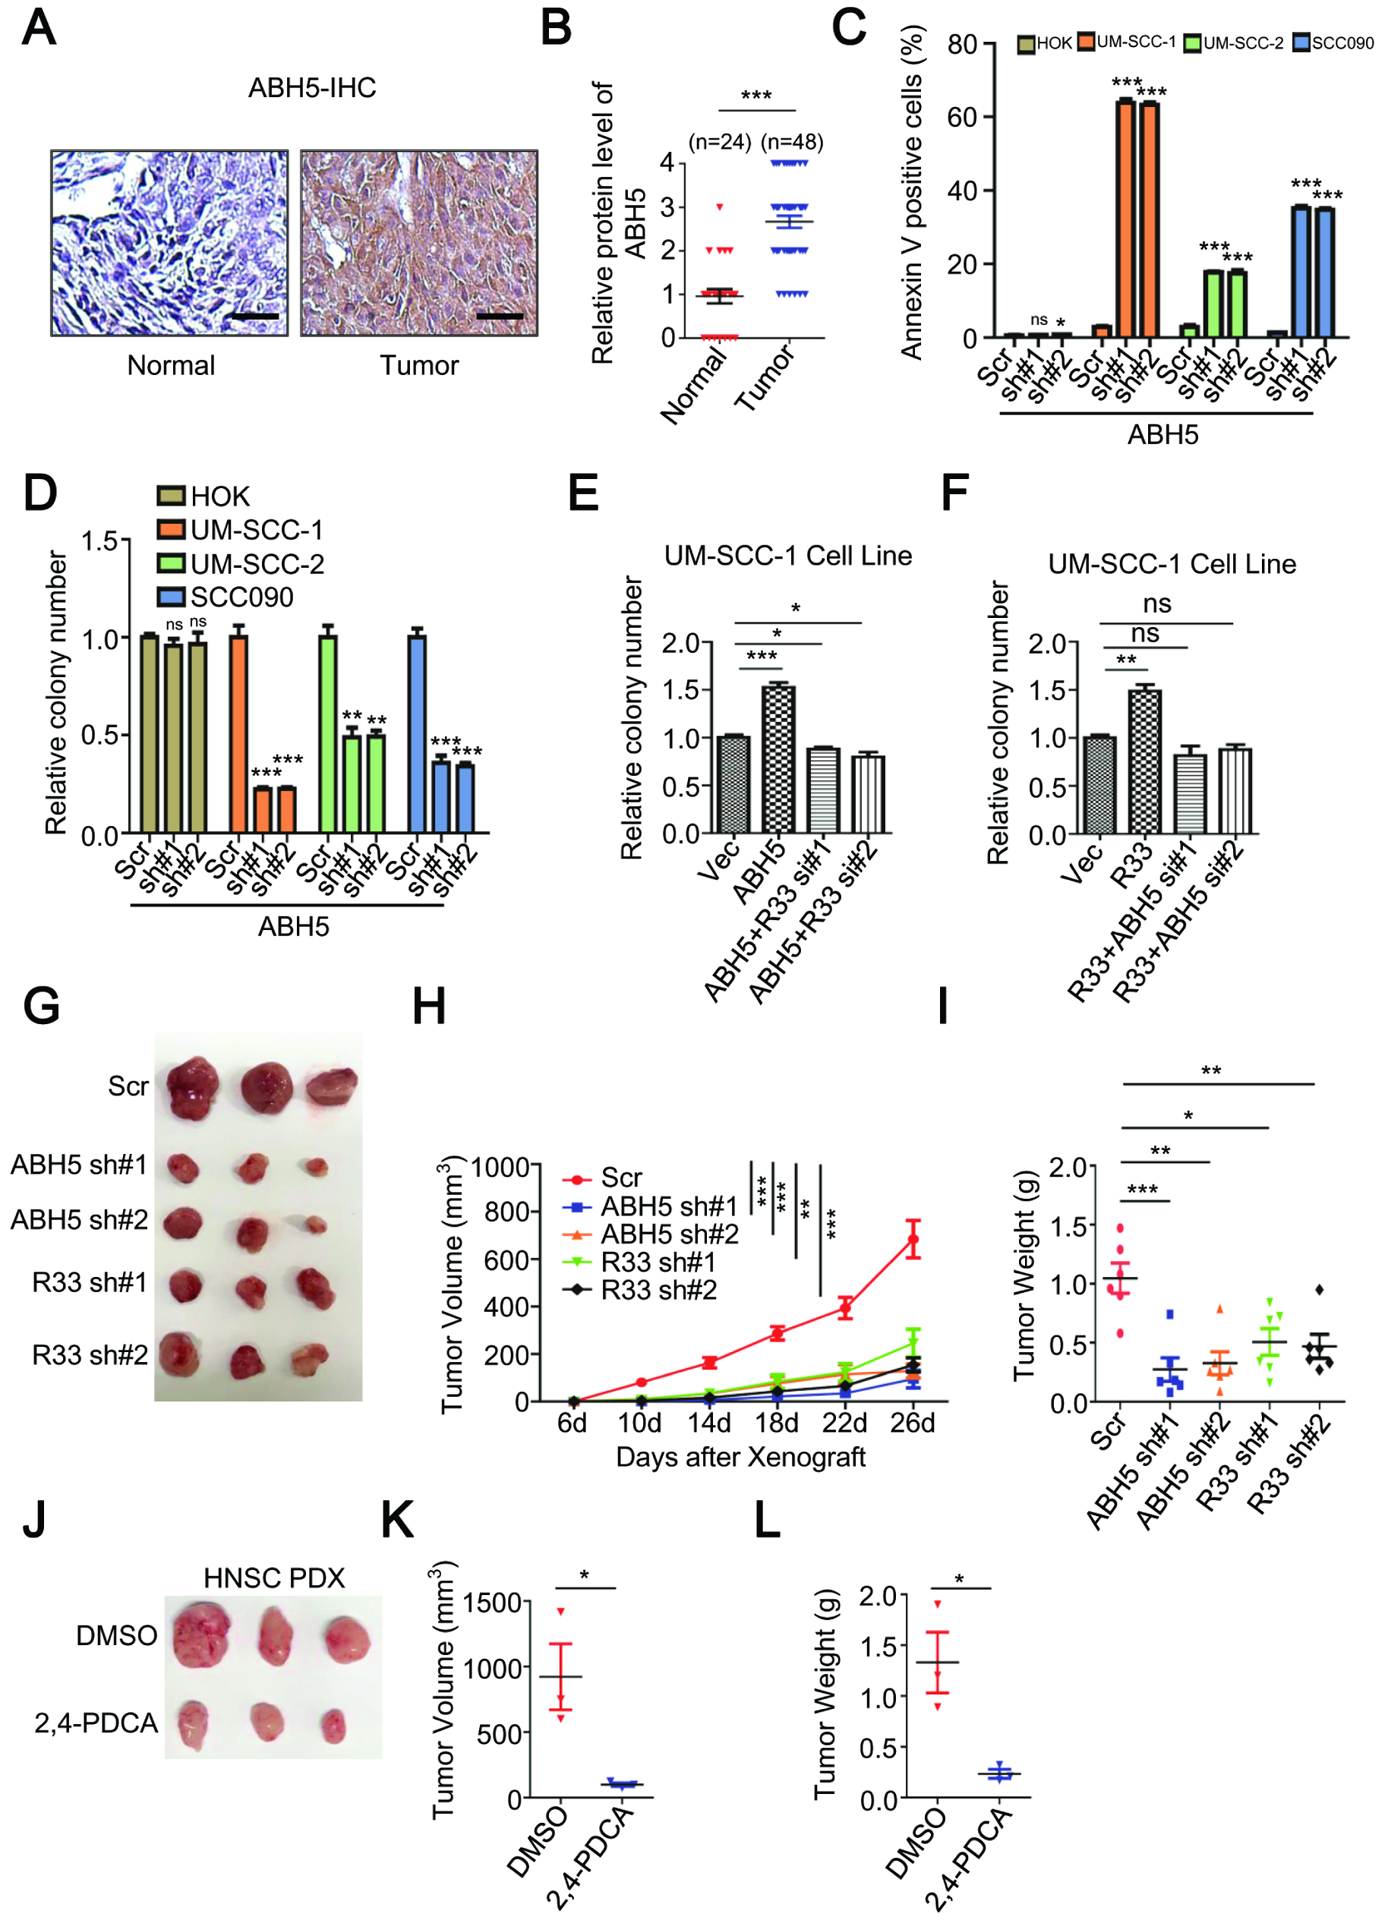
Figure. 6.

ALKBH5 is highly expressed in HNSCC patients and its depletion leads to HNSCC growth inhibition in vivo. (A) IHC analysis of ALKBH5 protein level in HNSCC primary tumors and normal adjacent tissues. Scale bars: 124.5 μm (B) Summary and statistical analysis of Figure. 6A. Data shown as medians with SEM. (C) Annexin V staining analysis as indicated. Data shown as medians with SEM. (D, E and F) Colony-forming analysis, shown as medians with SEM. (G, H and I) UM-SCC-1 xenograft assay, shown as medians with SEM. (J, K and L) HNSCC PDX assay, shown as medians with SEM.
