
Figure 1. Identification of a pair of nociception-inhibitory neurons in the central brain.
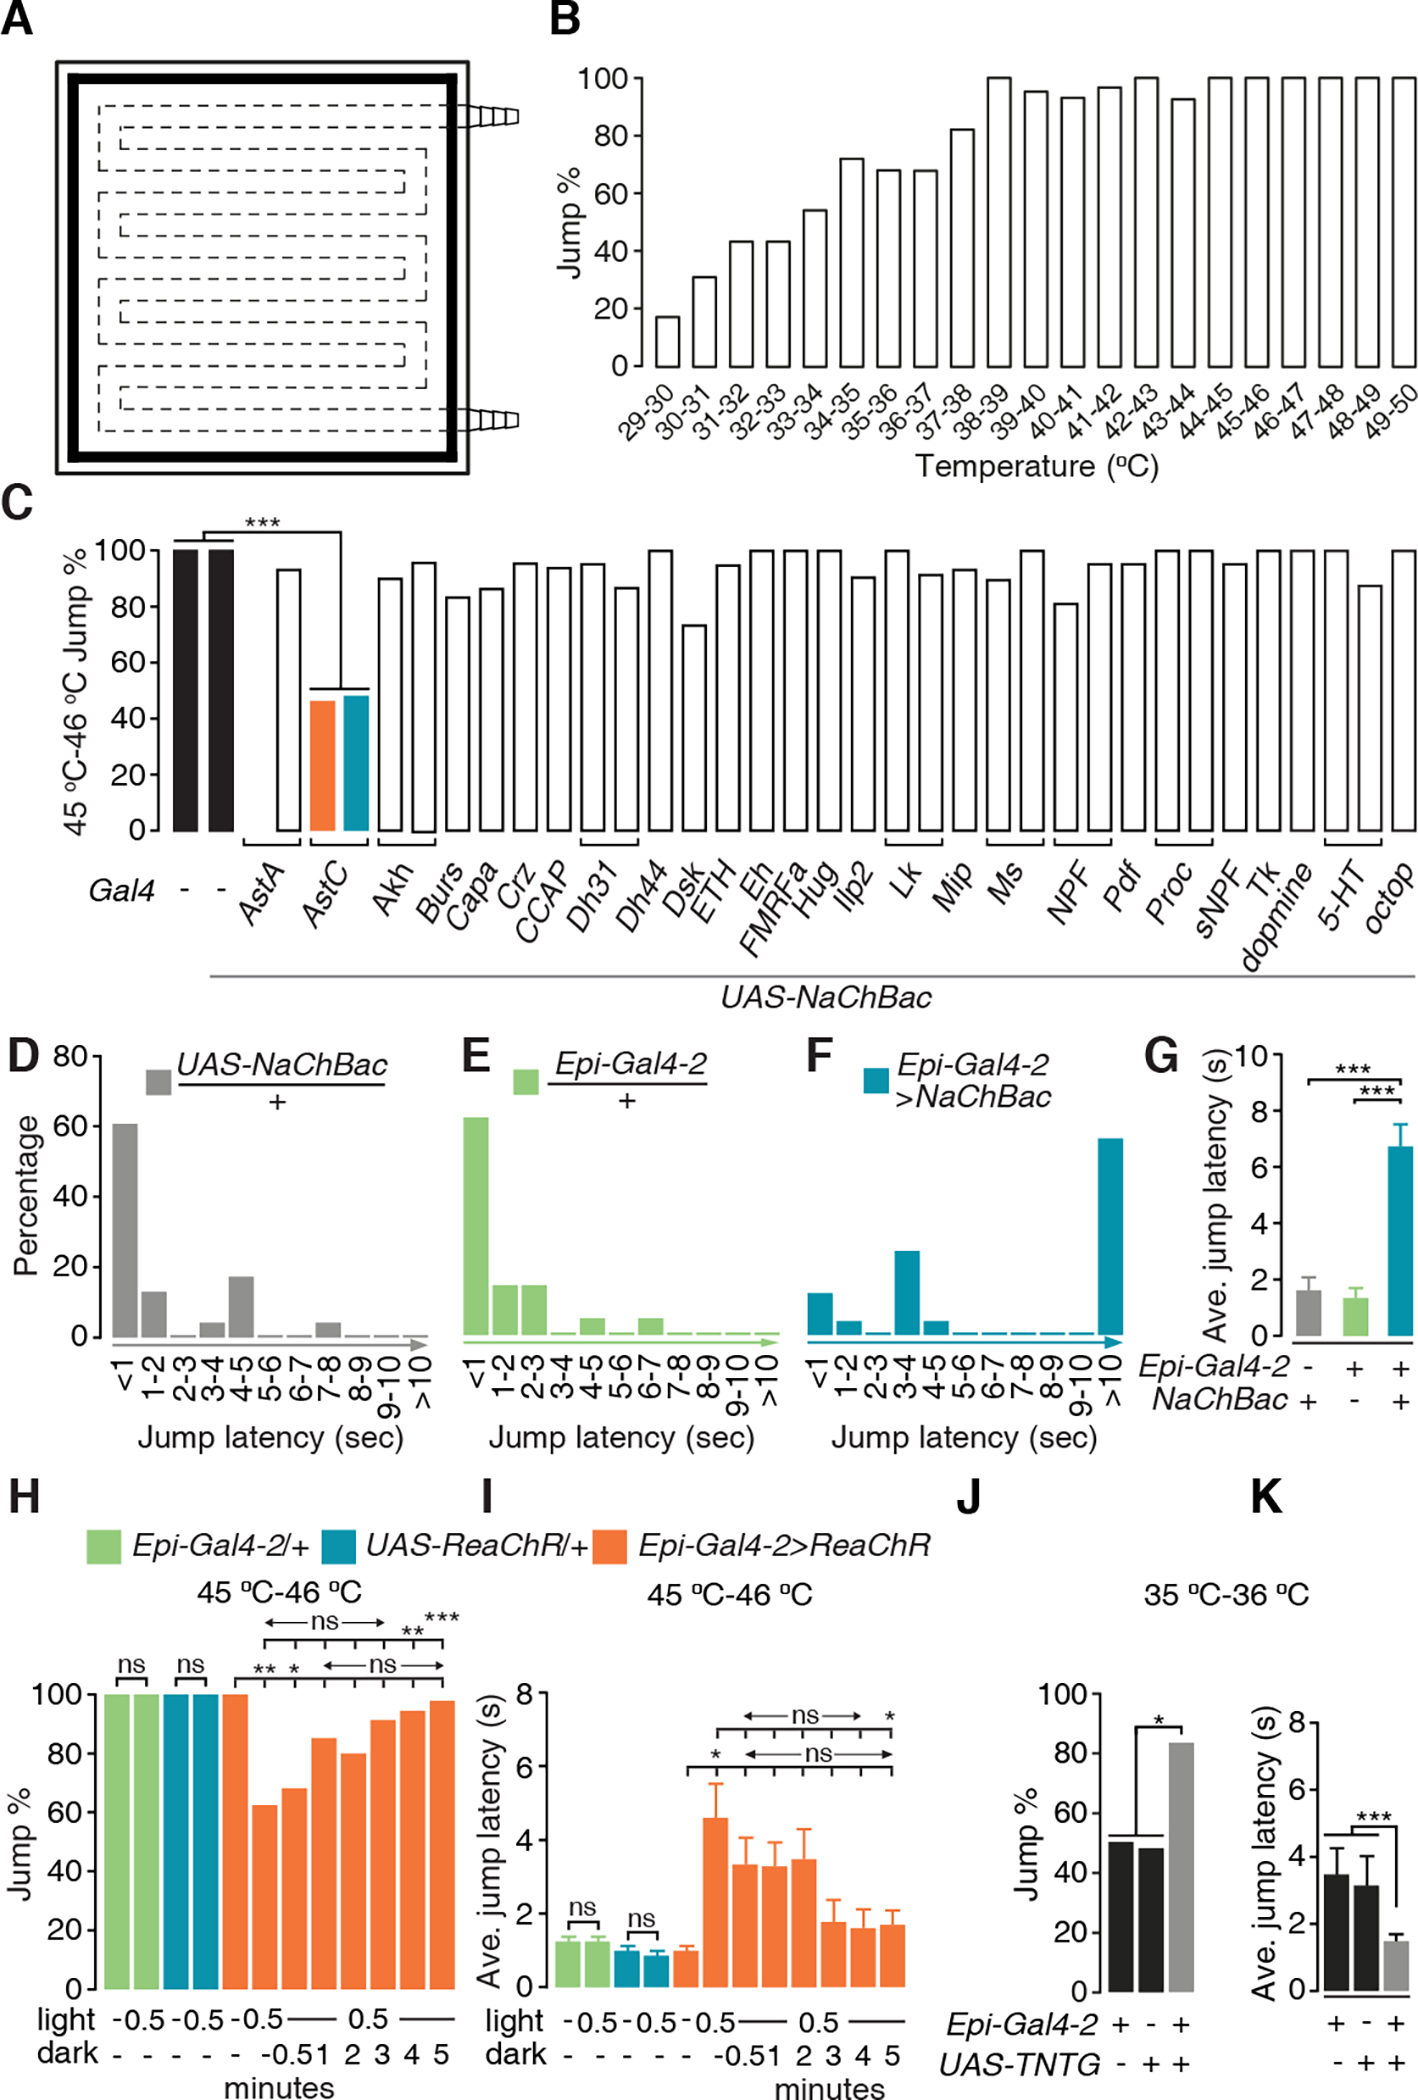
(A) Design of the hot plate for the jump assay. The dashed lines indicate water tunnels inside the plate. The black shading around the periphery represents the moat.
(B) Jump percentages of the control line (w1118) at different temperatures. n ≥ 20.
(C) Jump percentages (45 °C—46 °C) exhibited by flies expressing peptidergic and aminergic Gal4 lines driving expression NaChBac. The control lines (black bars) are w1118 (left bar) and UAS-NaChBac /+ (second bar from the left). n ≥ 20. Fisher’s exact test. *** P < 0.001.
(D-F) Percentages of flies showing the indicated jump latencies (sec) on a 45 °C—46 °C hot plate. (D) UAS-NaChBac only control. (E) Epi-Gal4-2 only control. (F) Epi-Gal4-2>NaChBac.
(G) Average values of jump latencies on a 45 °C—46 °C hot plate. n ≥ 20. Error bars indicate S.E.M.s. Mann-Whitney test. ***P < 0.001.
(H and I) Jump percentages (H) and average jump latencies (I) of flies on a 45 °C—46 °C hot plate, when Epi neurons were optogenetically activated for 0.5 min and then allowed to recover in the dark for 0.5—5 min. To stimulate the Epi neurons, the flies expressed UAS-ReaChR under control of the Epi-Gal4-2 and were stimulated with red lights. n ≥ 20. Error bars indicate S.E.M.s. Fisher’s exact test (H). Mann-Whitney test (I). *P < 0.05, **P < 0.01, ***P < 0.001, ns, not significant.
(J and K) Jump percentages (J) and average jump latencies (K) on a 35 °C—36 °C hot plate using flies in which the Epi neurons were blocked with TNTG. n ≥ 20. Error bars indicate S.E.M.s. Fisher’s exact test (J). Mann-Whitney test (K). * P < 0.05, ***P < 0.001.