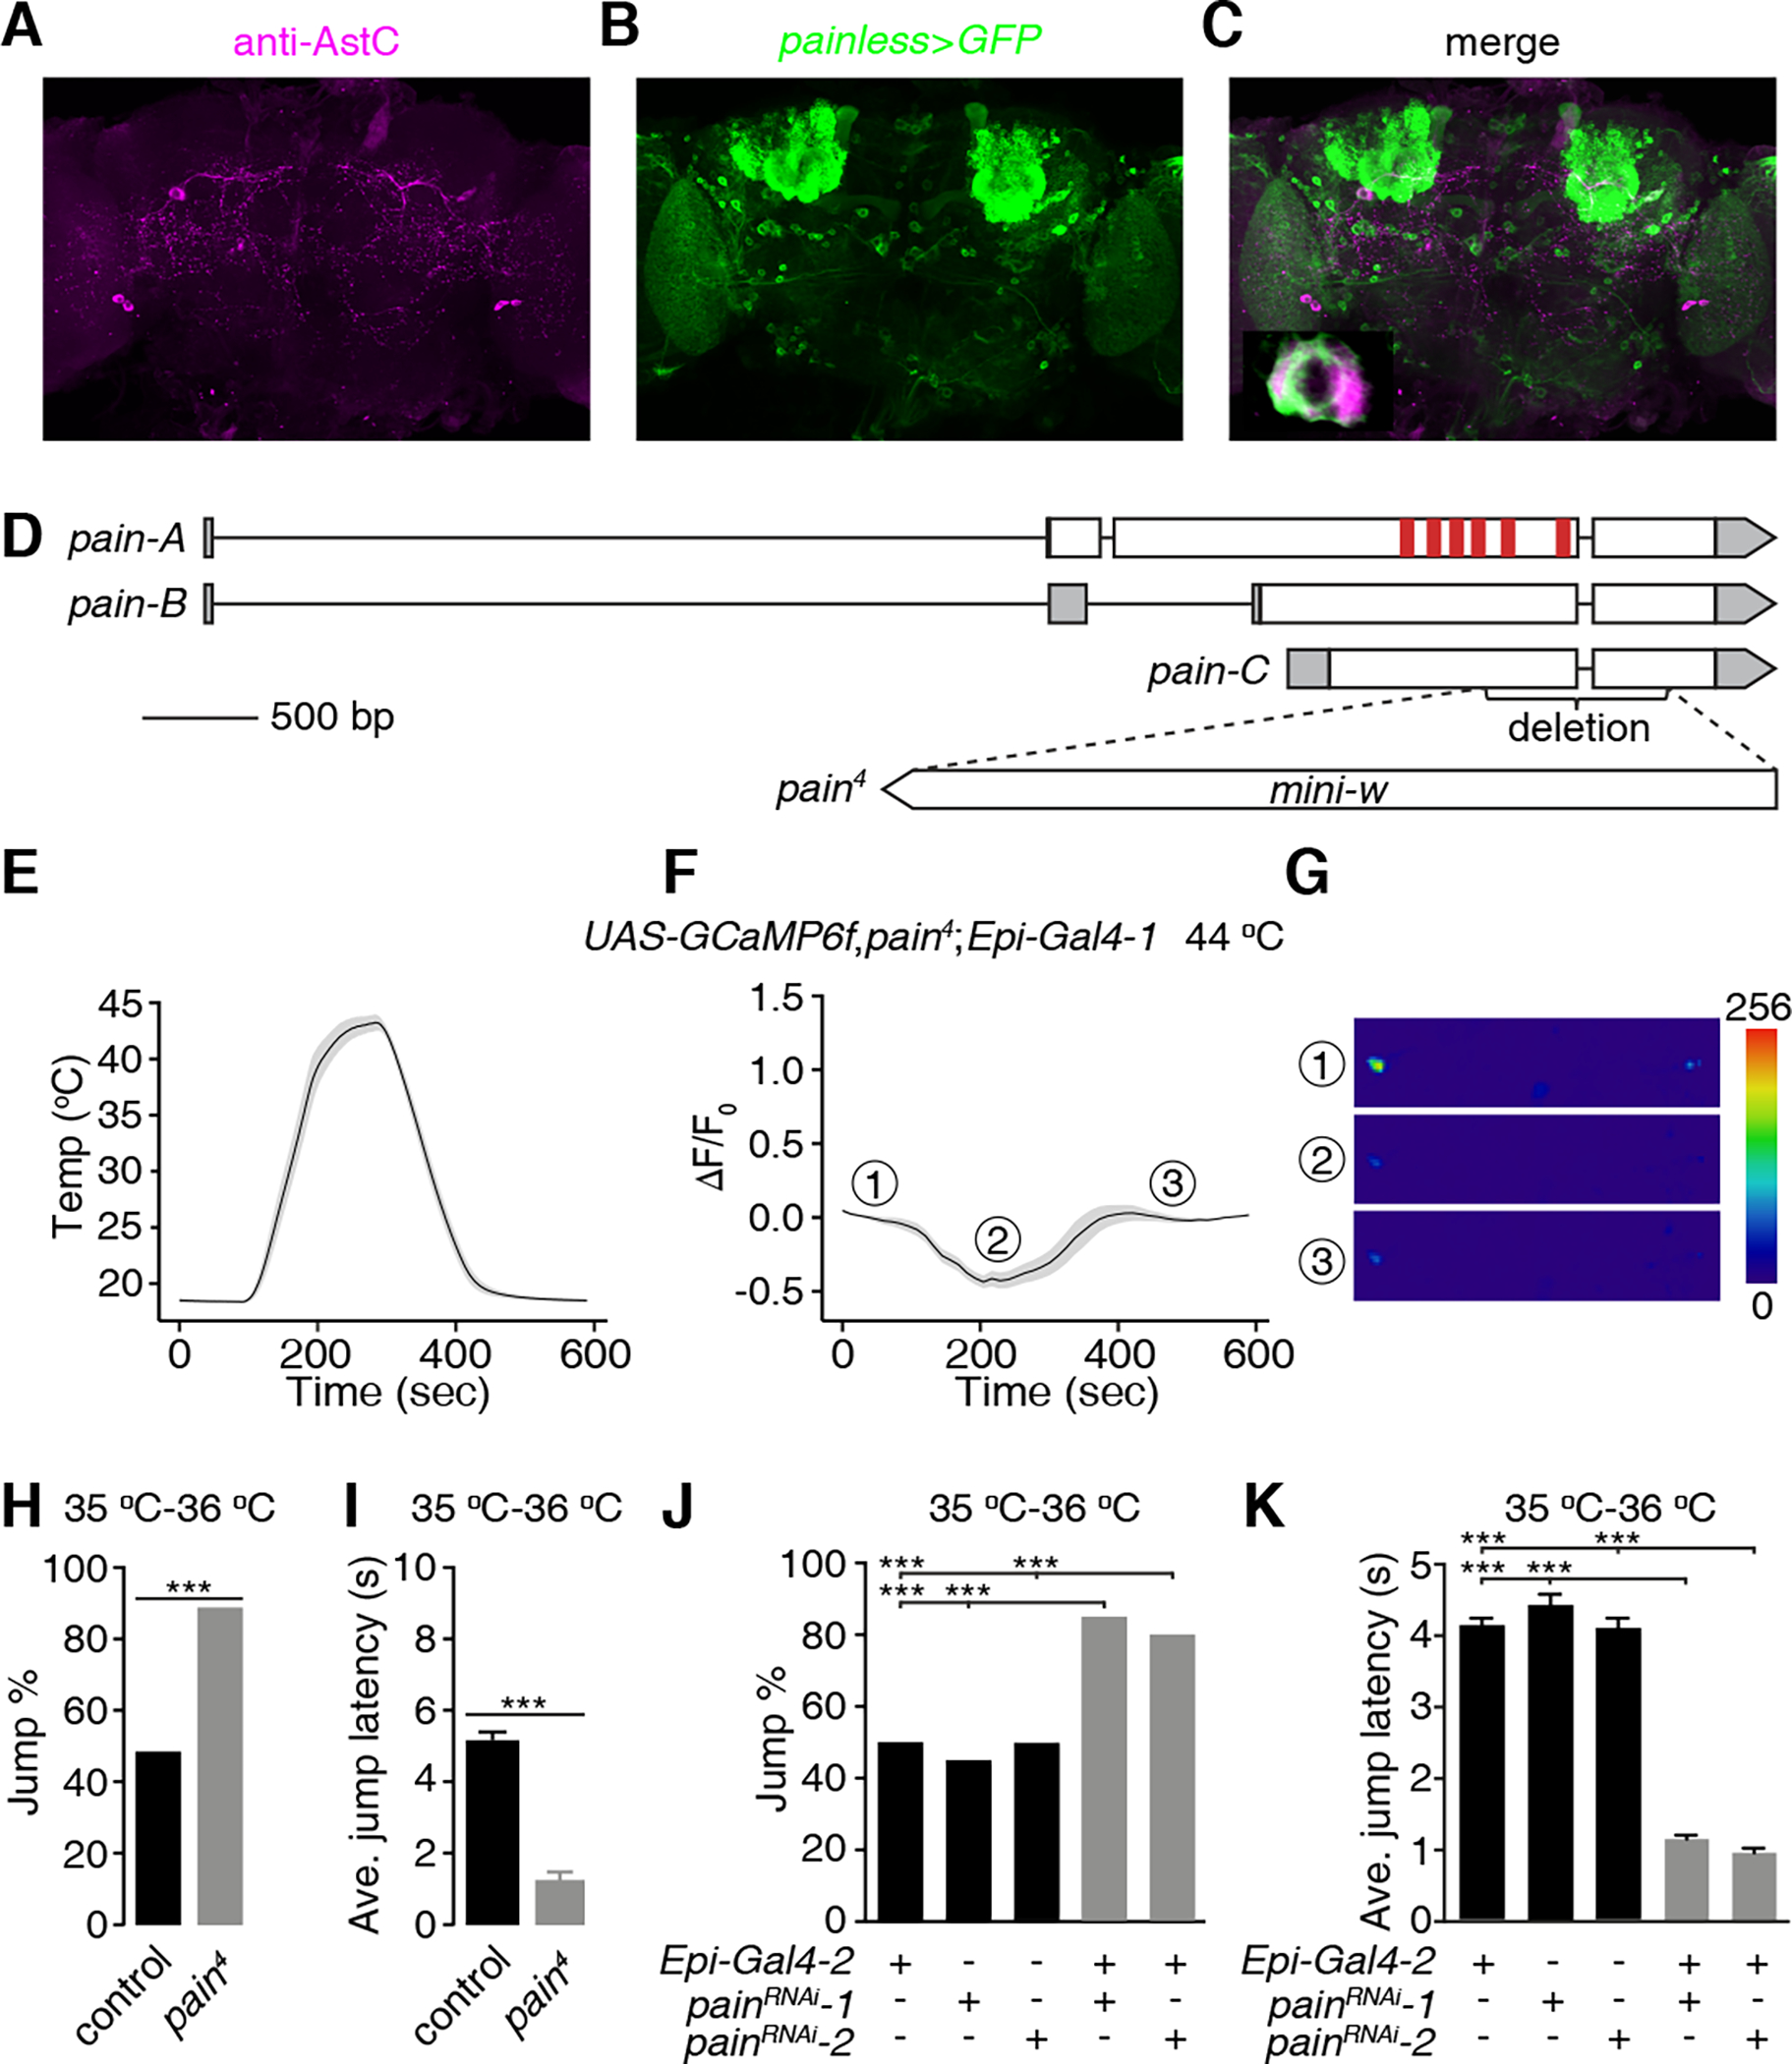
Figure 5. painless functions in Epi neurons,.

(A-C) Testing for co-localization of anti-AstC staining with the pain reporter. A brain from a fly expressing UAS-mCD8::GFP under control of the pain-Gal4 (painless>GFP) was stained with anti-AstC and anti-GFP (green, B). (A) Rabbit anti-AstC (magenta). Scale bar indicates 50 μm. (B) Chicken anti-GFP. (C) Merge of (A and B). Bottom-left panel is an enlarged image of the framed area. Scale bar indicates 5 μm.
(D) Schematic of the gene structure of the wild-type pain gene and the pain4 mutant. The red vertical bars represent the six transmembrane domains.
(E-G) GCaMP6f responses of Epi neurons from pain4 brains during a temperature ramp (maximum 44 °C). (E) Temperature ramp. (F) Changes in GcaMP6f signals (ΔF/F0) in response to the temperature ramp in (E). The ①, ②, and ③ indicate the time points for the sample images in (G). (G) Sample images of GCaMP6f signals displayed by Epi neurons (indicated by the dashed circles) at three time points during the Ca2+ imaging in (F). Scale bar indicates 50 μm. n = 23 neurons from 15 dissected brains.
(H and I) Jump percentages (H) and average jump latencies (I) of control and pain4 flies on a 35 °C—36 °C hot-plate. n ≥ 20. Error bars indicate S.E.M.s. Fisher’s exact test (H). Mann-Whitney test (I). ***P < 0.001.
(J and K) Effect of RNAi knockdown of pain in Epi neurons on jump percentages (J) and average jump latencies (K) using flies on a 35 °C—36 °C hot-plate. n ≥ 20. Error bars indicate S.E.M.s. Fisher’s exact test (J). Mann-Whitney test (K). ***P < 0.001. See also Figure S5.
