Figure 2:

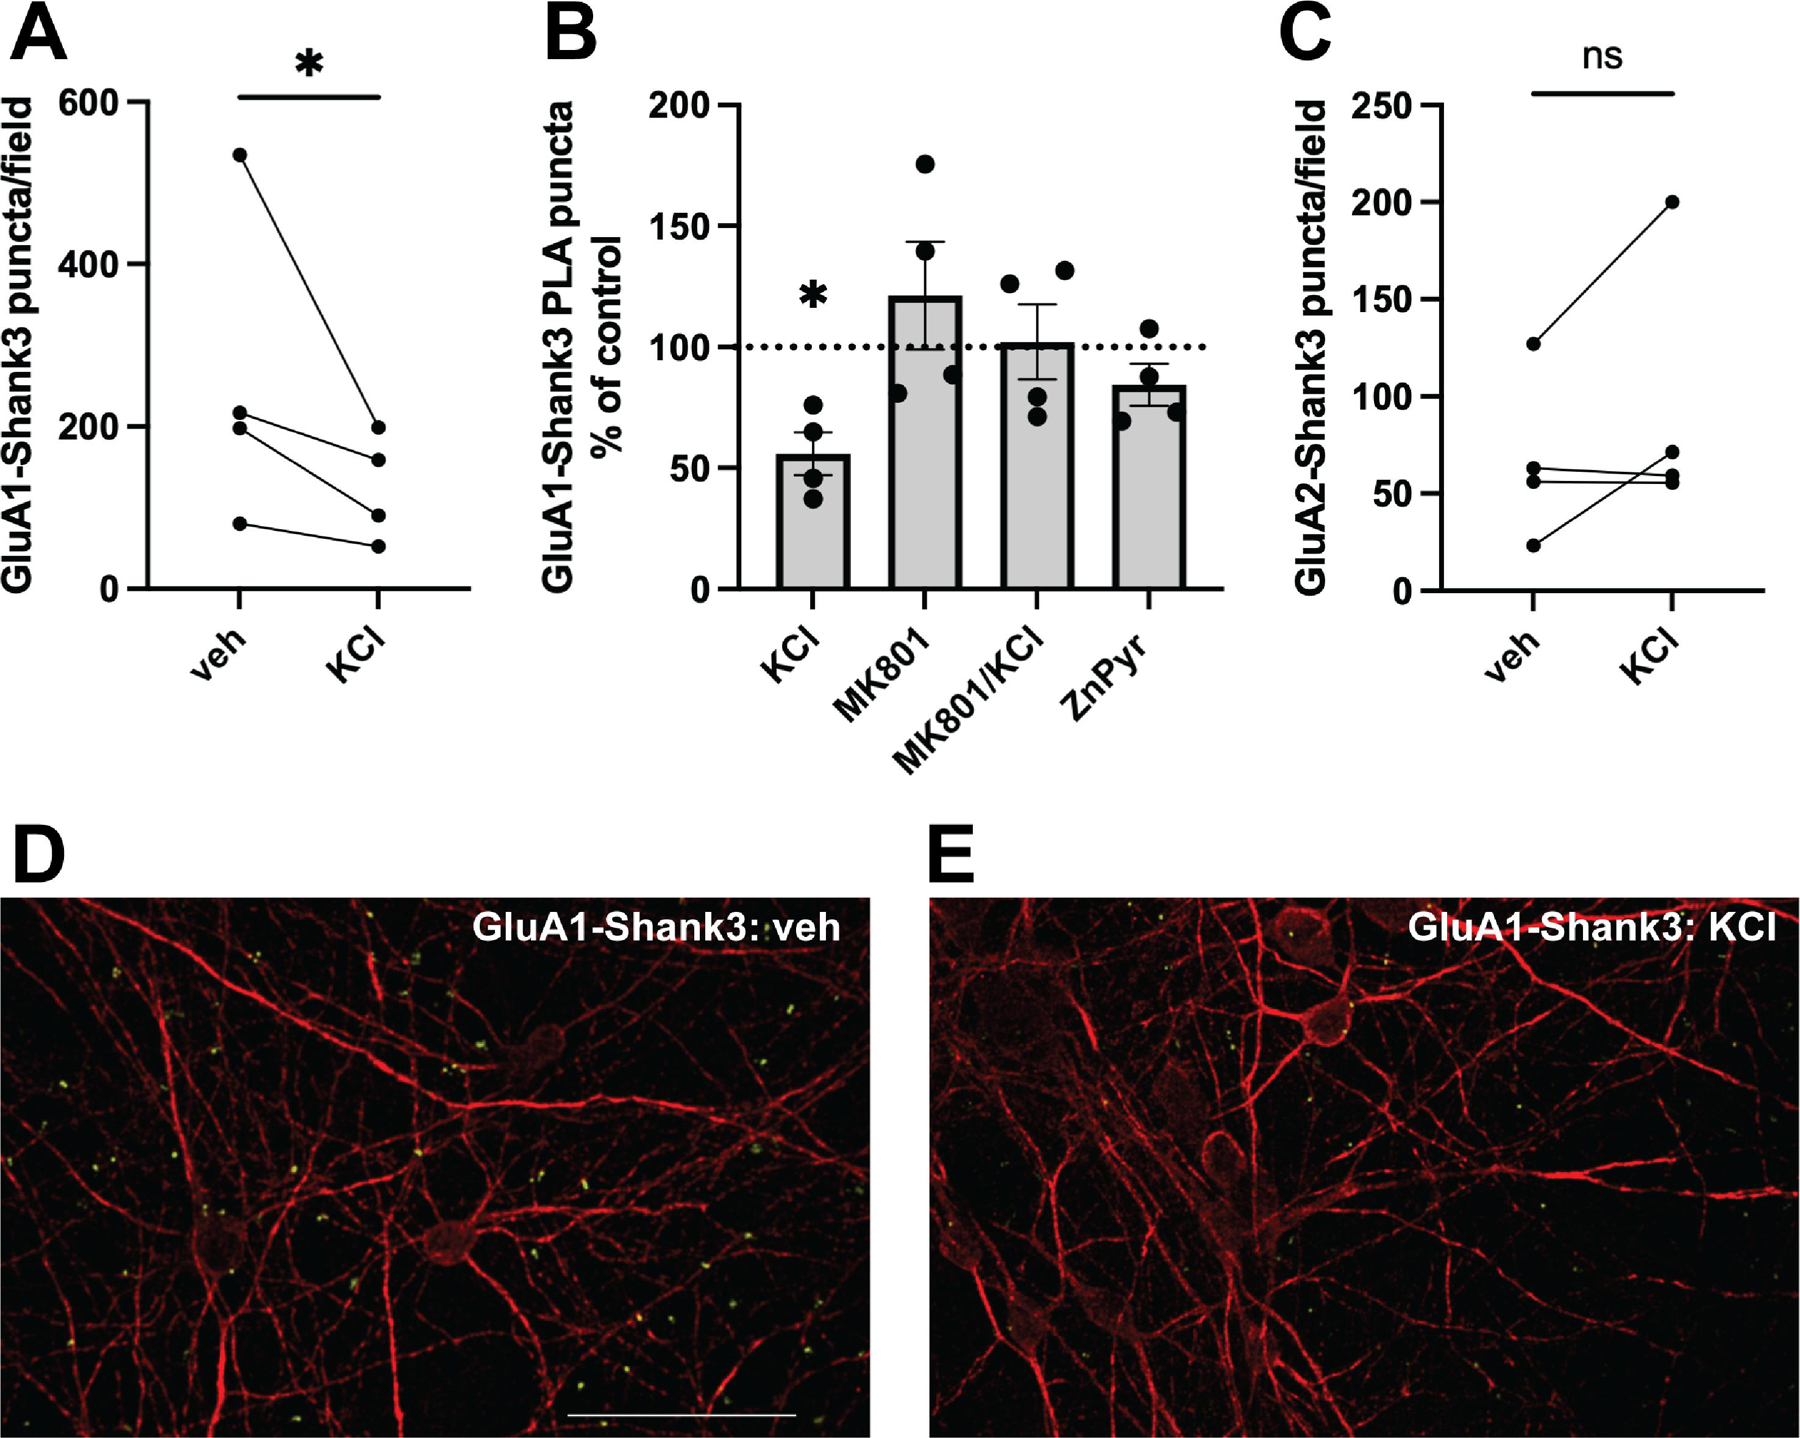
Prolonged depolarization causes a decrease in GluA1-Shank3 but not GluA2-Shank3 interaction. (A) Average number of GluA1-Shank3 PLA puncta per imaging field in sister cortical cultures incubated in the presence or absence of KCl treatment (ratio paired t test, p=0.0276, n=4). (B) PLA puncta quantified as a percent of control for each experimental condition. GluA1-Shank3 interaction decreased following overnight exposure to 25 mM KCl (one sample t test, p=0.0156, n=4). There was no significant change in GluA1-Shank3 interaction following overnight exposure to 10 μM MK801 alone (one sample t test, p=0.4126, n=4), co-exposure to 10 μM MK801 plus 25 mM KCl (one sample t test, p=0.9029, n=4), or 5 μM ZnCl2 plus 250 nM pyrithione (ZnPyr) (one sample t test, p=0.1714, n=4). (C) Average number of GluA2-Shank3 PLA puncta per imaging field in sister cortical cultures incubated in the presence or absence of KCl treatment (ratio paired t test, p=0.2645, n=4). (D-E) Representative images of PLA between GluA1 and Shank3 under control conditions (D) and following an overnight 25 mM KCl exposure (E). Neuronal morphology is shown with Map2 immunofluorescence (red), and PLA reactions are represented as discrete green puncta. Scale bar = 50 μm.
