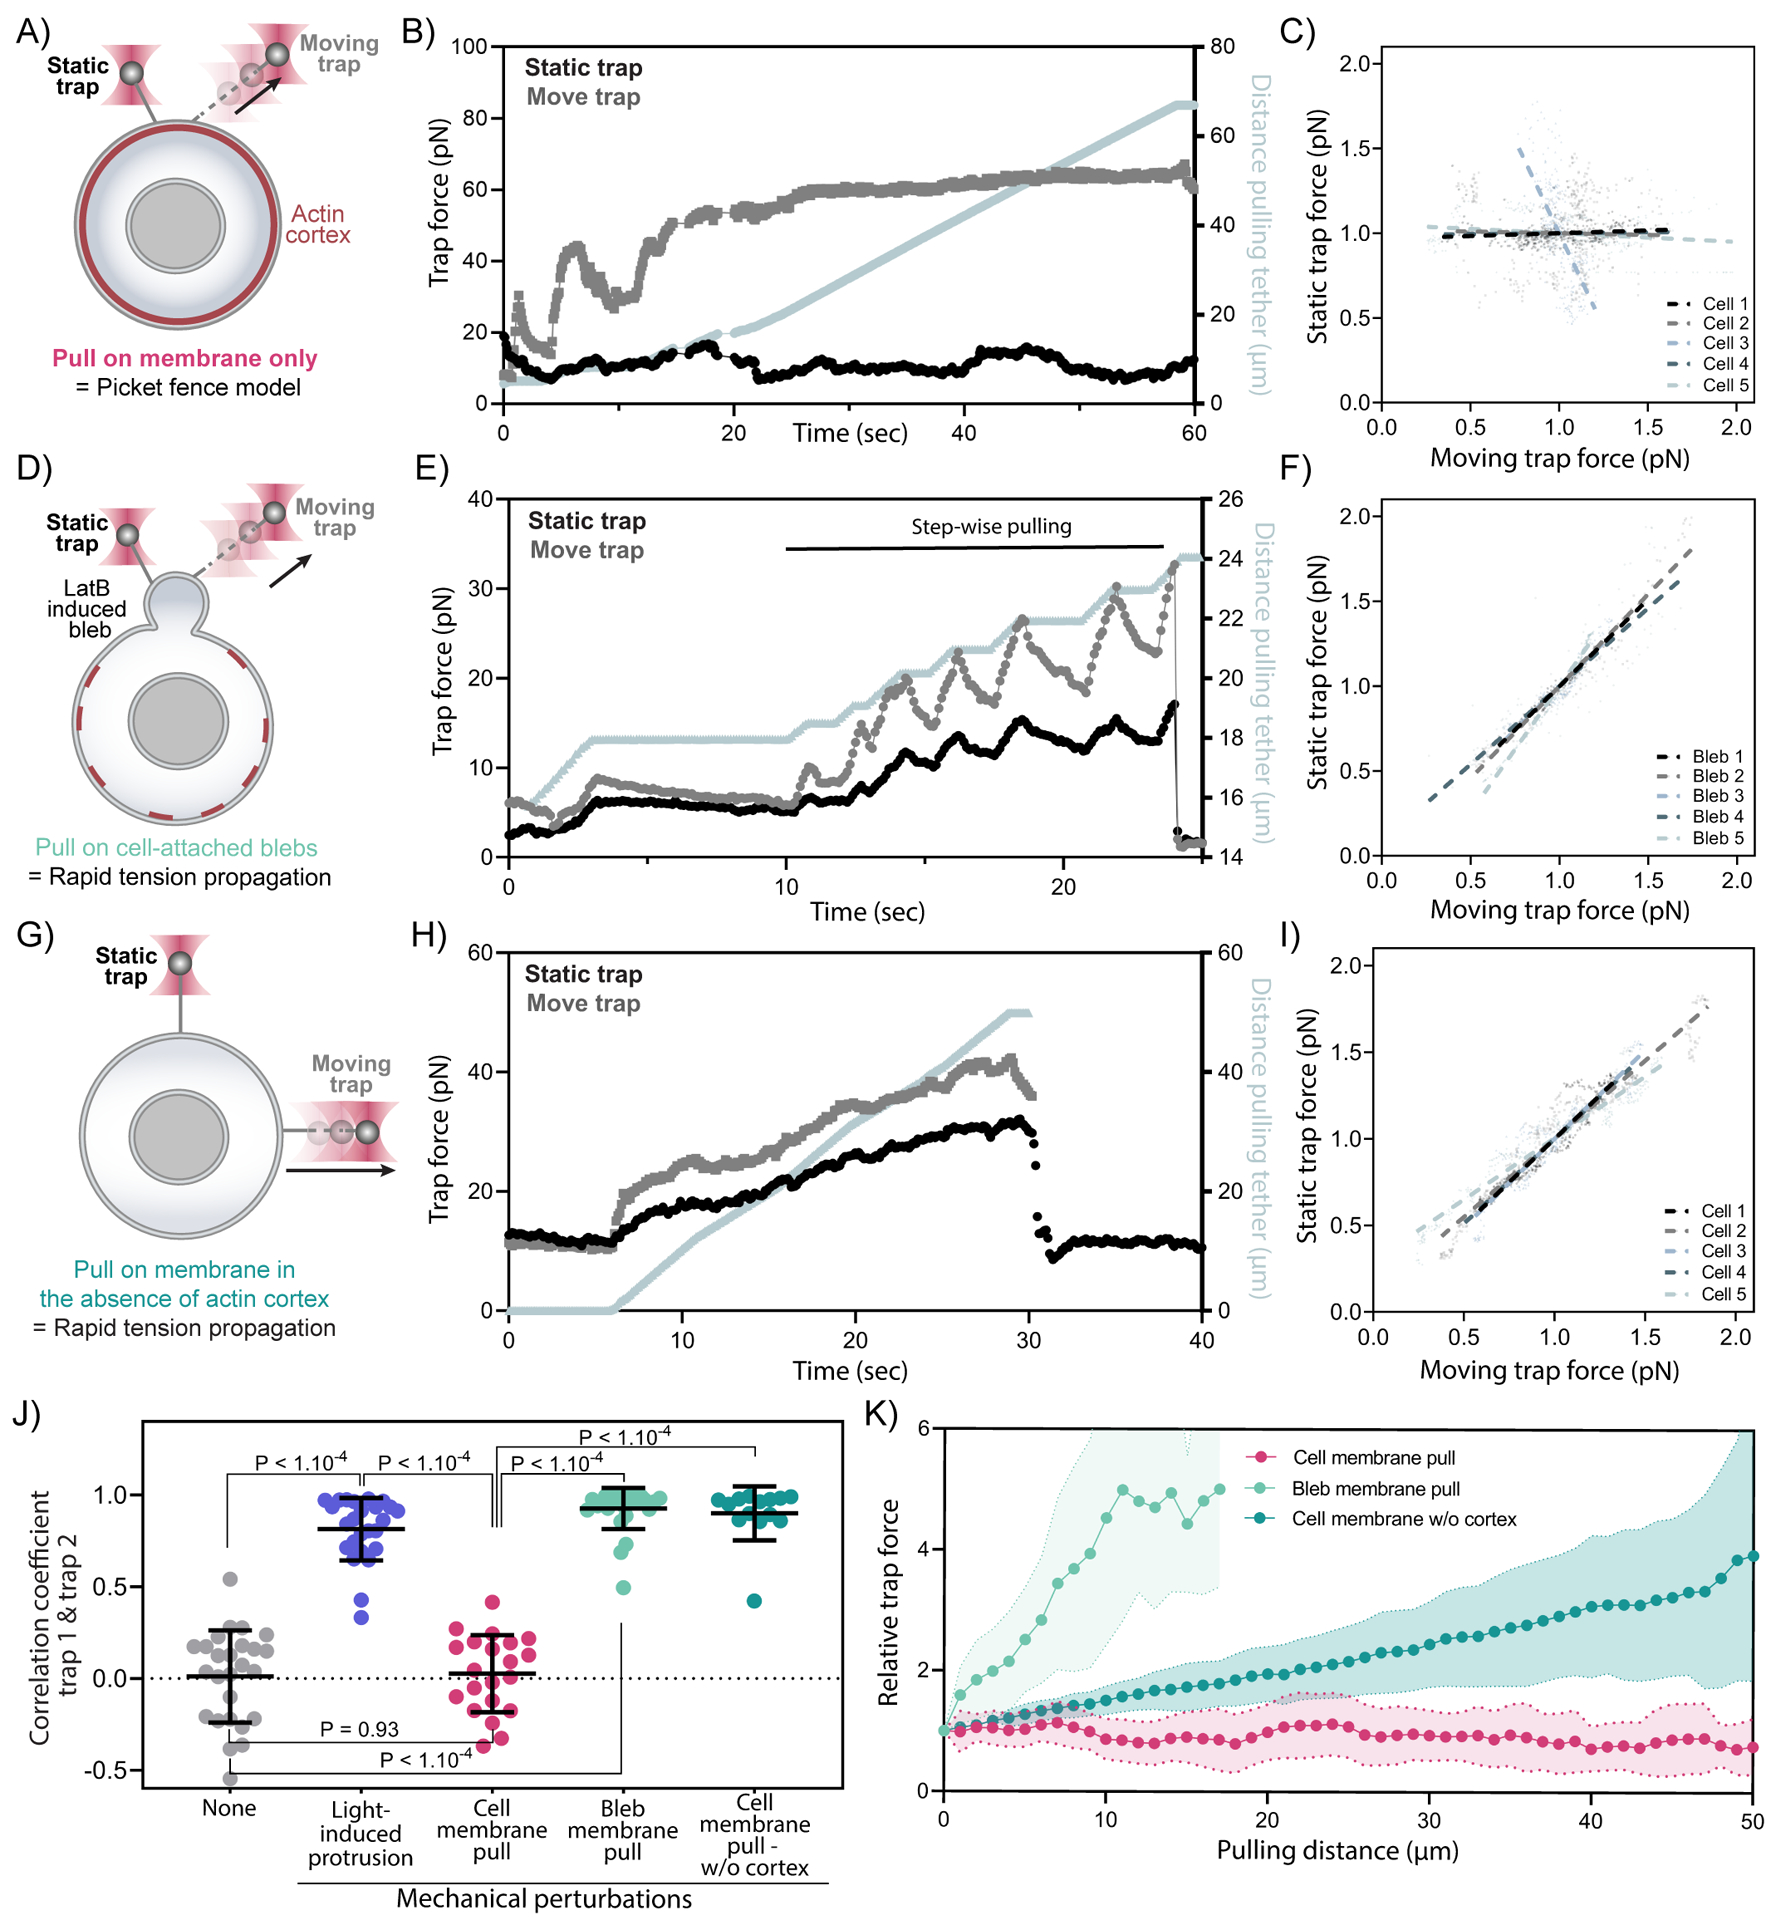
Figure 3. Membrane tension does not propagate upon direct mechanical pulling on the cell membrane.

(A) A dual-tether assay to detect tension propagation (static tether, left) while a nearby force is exerted through the use of an optically trapped bead to pull on the membrane ~2-um away (moving tether, right). (B) An example time trace of trap force for dual membrane tension measurements, where one moving trap (T2, grey) dynamically pulls on the cell membrane by continuously pulling and extending the membrane tether, while the other trap controls a second static membrane tether (T1, black) to monitor nearby changes in membrane tension. The increase in length of the extending tether from the cell body is plotted in grey along the right y-axis. (C) Correlation plots of normalized trap forces between the moving and static tethers. Five representative measurements from different cells are shown; dashed lines: linear regression. (D)(E)(F) Similar to (A)(B)(C) but probing tension in blebs (membrane detached from actin cortex generated by using latrunculin B treatment to weaken the actin cortex); here a high correlation is observed between static and moving tethers. (G)(H)(I) Similar to (A)(B)(C) but probing tension in cells where the actin cortex has been significantly disassembled using a combination of latrunculin B treatment and osmotic shock; a high correlation is observed between static and moving tethers even at a significant distance from one another (here 90 degrees, but in supplement S3H-J 180 degrees. (J) Pearson correlation coefficient between dual trap forces measured before perturbations (None; light gray), upon light-activated protrusions (purple; Figure 2), during cell membrane pulling (pink; panel A-C), during membrane pulling on a bleb (light green; panel D-F), and during cell membrane pulling in cells with heavily disassembled actin cortex (Dark green; panel G-I). Error bar: means ± SD; p values from Welch’s unpaired Student’s t test (n>15, N>3). (K) Relative force changes (y-axis) for membrane tension monitored on the static tether as a function of the extending tether length (x-axis) upon continuous pulling. In the case of blebs or cells with heavily disassembled actin cortex (light and dark green), the tension on static tether increases as the extending tether lengthens; however, there are no perceptible tension changes on the static tether tension from the cell body (pink, intact cortex) even when the other tether has extended by more than 60 μm (n>14, N>3). Graphical data represent means ± SDs. See also Figure S3 and Video S2.
