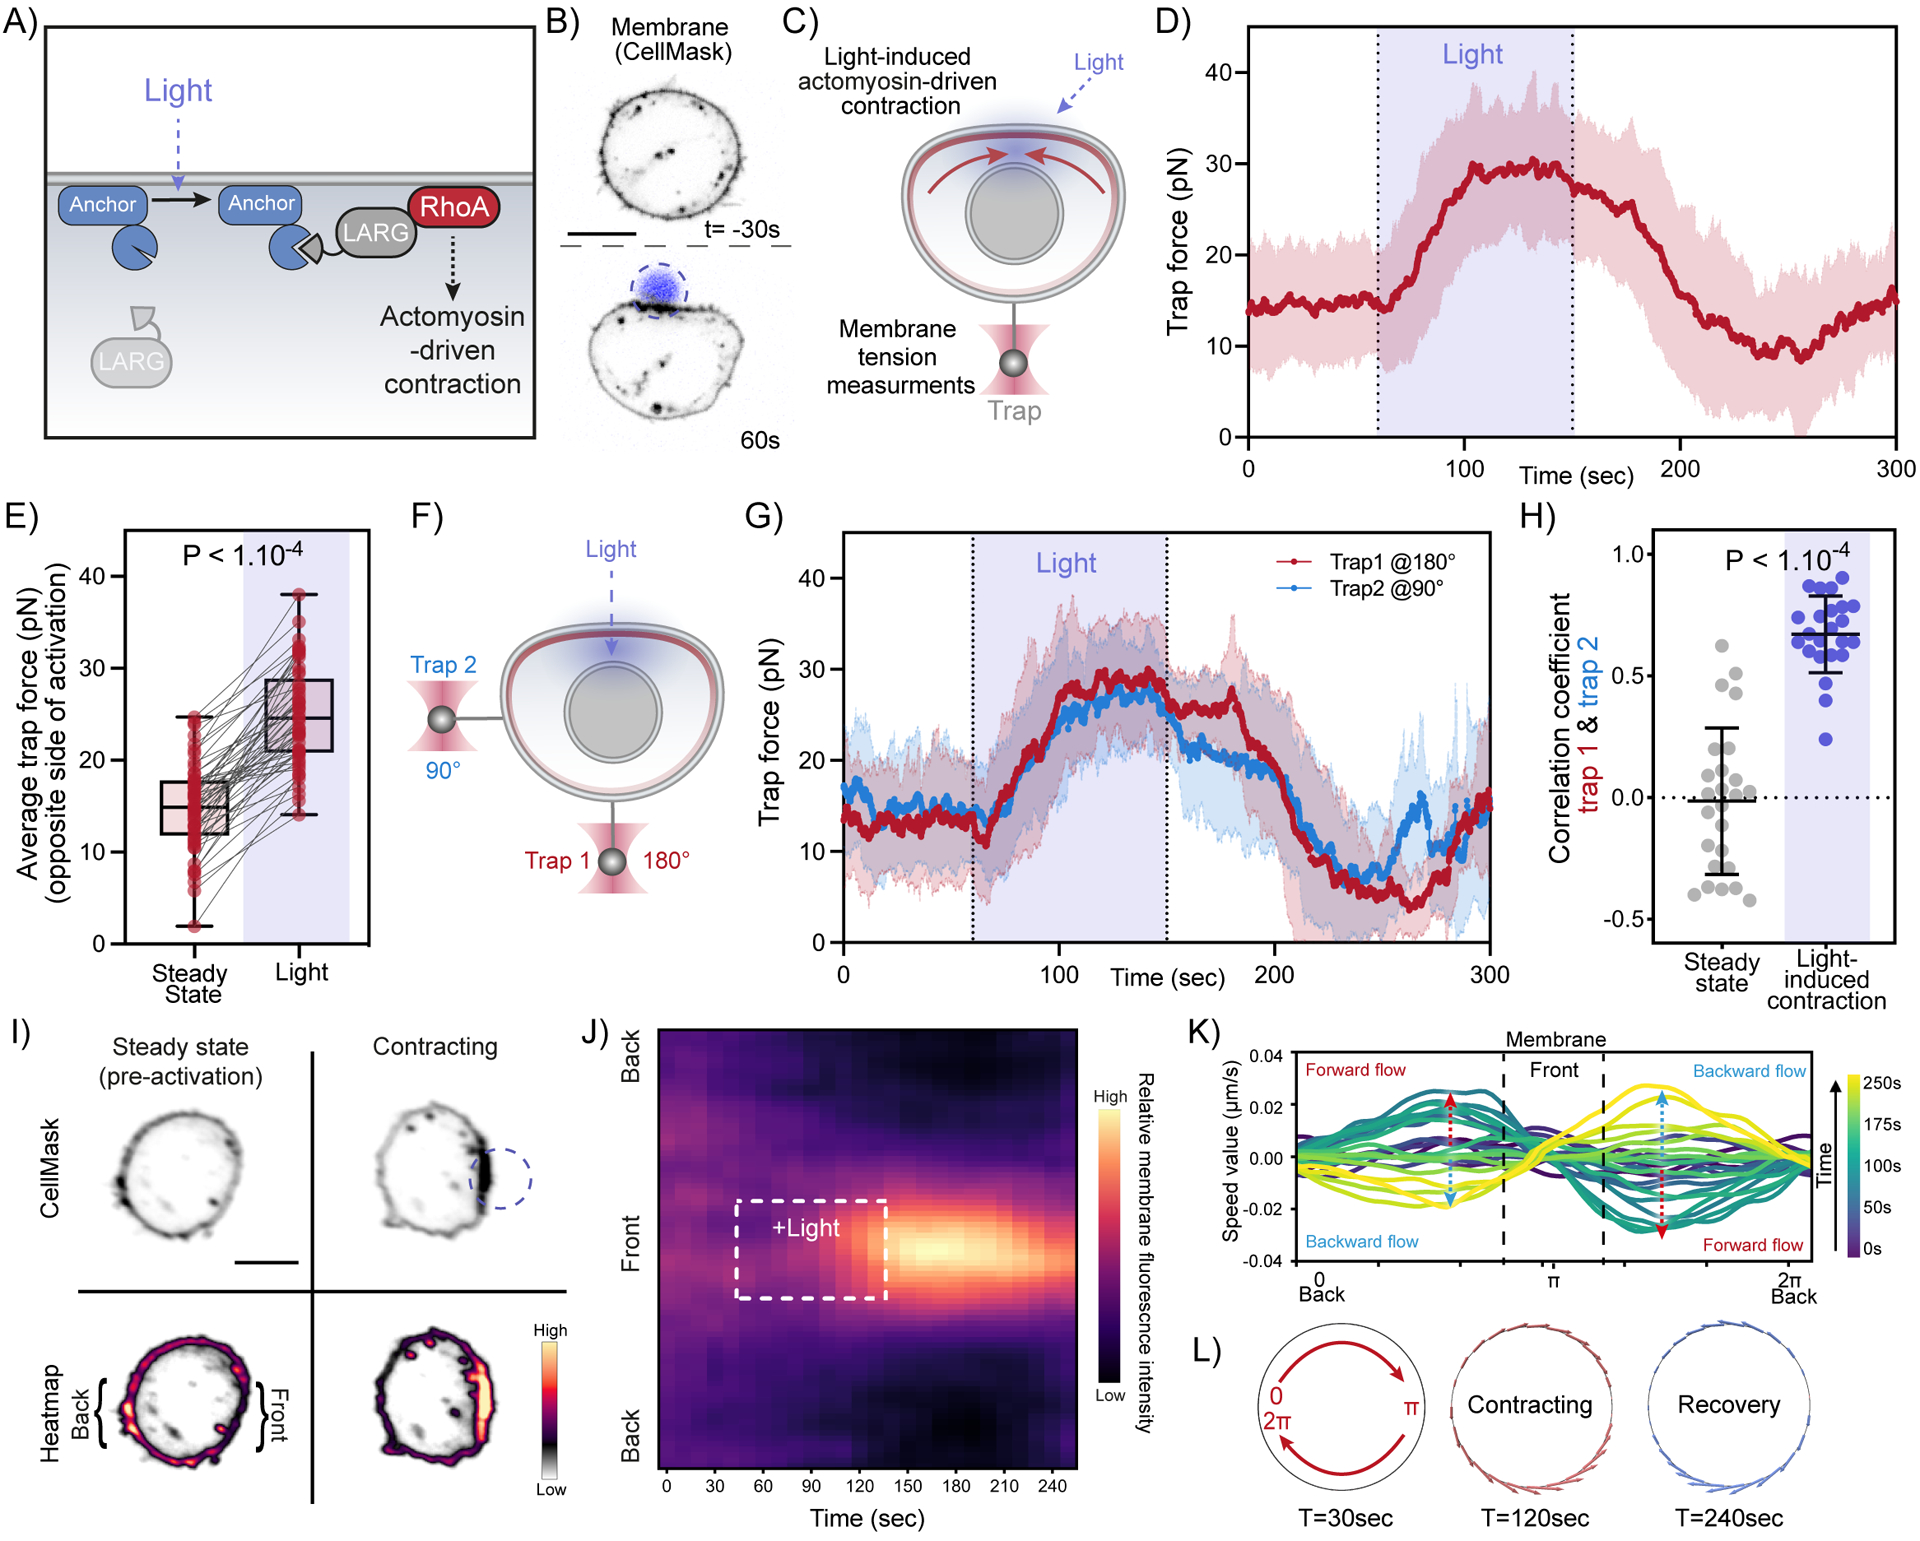
Figure 5. Optogenetically-induced actomyosin contractions generate rapid long-range membrane tension propagation and membrane flows.

(A) Optogenetic approach for light-induced activation of leukemia-associated Rho guanine nucleotide exchange factor (LARG), resulting in Rho GTPase activation to initiate actomyosin-driven cell contraction (see Methods). (B) Time-lapse confocal images of a neutrophil-like HL-60 cell expressing opto-construct (Opto-LARG) and membrane marker (CellMask) showing localized membrane contraction and cell flattening upon light activation. (C) Following light-activated contraction on one side of the cell (top), changes in membrane tension on the opposite side (bottom) are measured via a membrane tether held by an optical trap. (D) Averaged time trace of trap force before (Steady-state), during (Light), and after activating cell contraction (means ± SD; n>55, N=7). (E) Averaged trap force before (Steady-state) and during activation. Box and whiskers: median and min to max; p values from Wilcoxon paired Student’s t test. (F) A dual-tether pulling assay to simultaneously monitor membrane tension on the far-end (left, trap 1 at 180°) and on the side of the cell (top, trap 2 at 90°) during light-activated contraction. (G) Averaged traces of dual trap forces before, during (Light), and after activation showing coinciding tension increases on both membrane tethers adjacent to (trap 2) and at the opposite cell surface from (trap 1) contraction (n=25, N=4). (H) Pearson correlation coefficient between dual trap forces measured at steady state and during light activation. Error bar: means ± SD; p values from Welch’s unpaired Student’s t test (n>20, N>4). (I) Confocal images of opto-LARG cells stained with membrane marker (CellMask) before and during light-activated contraction. Scale bars: 5 μm. (J) Kymographs of membrane fluorescence along the normalized cell circumference (y-axis) show that over time (x-axis) membrane accumulates towards the contracting cell front and is depleted from the back (n=40, N=3; see Methods). (K) Membrane flow field inferred using optimal transport from kymograph intensity changes over time: shortly after activation begins (t=120s, teal traces), the magnitude of membrane flow speed increases (red dashed arrows), with positive speed for clockwise flow along the cell upper half and negative speed for counterclockwise flow along the bottom half, all moving towards the site of cell contraction (π). During recovery (t=200s, light green traces), the direction of membrane flow reverses (blue dashed arrows). (L) Membrane flow around the cell before, during, and after (t=30, 120, 240s) right-side contraction; the flow magnitude is denoted by the arrow size (red: forward flow, blue: backward). Membrane flows toward the contraction in the contracting phase and away from the contraction during the recovery phase. Scale bars: 5μm. See also Figure S5 and Video S4.
