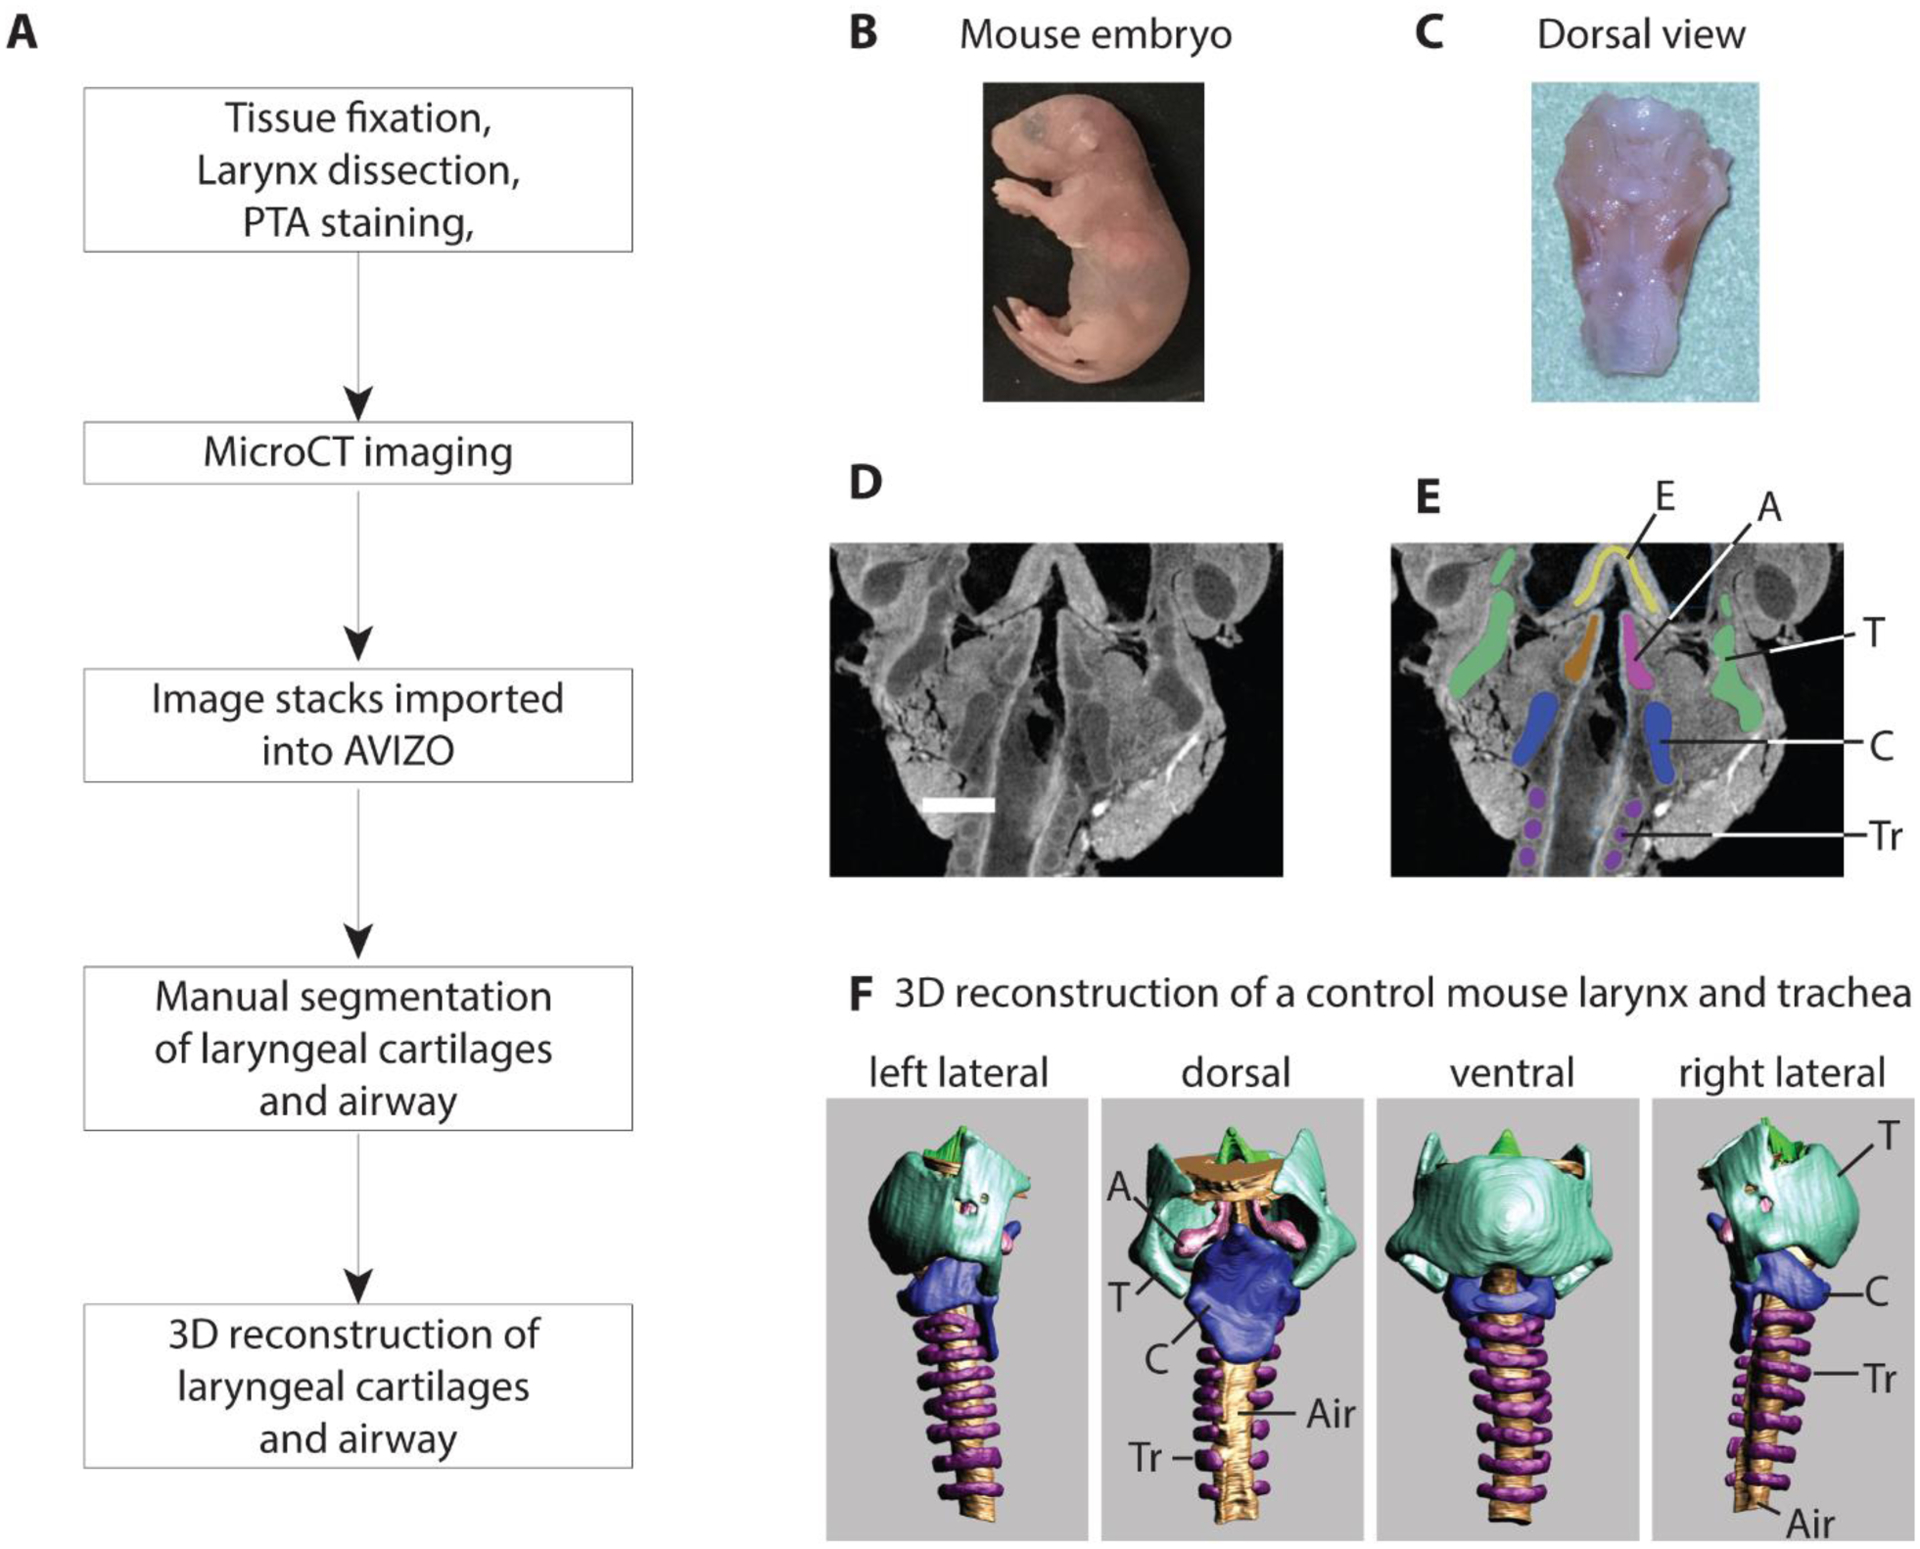
Figure 1:

Workflow for the generation of 3D surface renditions of the mouse larynx (A). Mouse fetuses were retrieved at embryological stage E18.5 or P0 (B). The larynx was dissected and fixed in neutral buffered formalin, transferred to ethanol, and then stained in a phosphotungstic acid (PTA) solution (C). Panels D and E show CT scan images before and after manual segmentation. MicroCT scans were generated at 4 micometer image resolution (D). Cartilages and airways were manually outlined (blue-cricoid cartilage; green-thyroid cartilage; lila-tracheal rings; pink and brown – left and right arytenoid cartilage) (E). Panel F shows different views of the 3D-surface rendition of larynx and trachea of one control mouse. All laryngeal cartilages and the laryngeal airway were assembled for qualitative and quantitative evaluation (F).
T=thyroid cartilage, C=cricoid cartilage, Tr=tracheal ring, Air=airway, A=arytenoid cartilage, E=epiglottis
