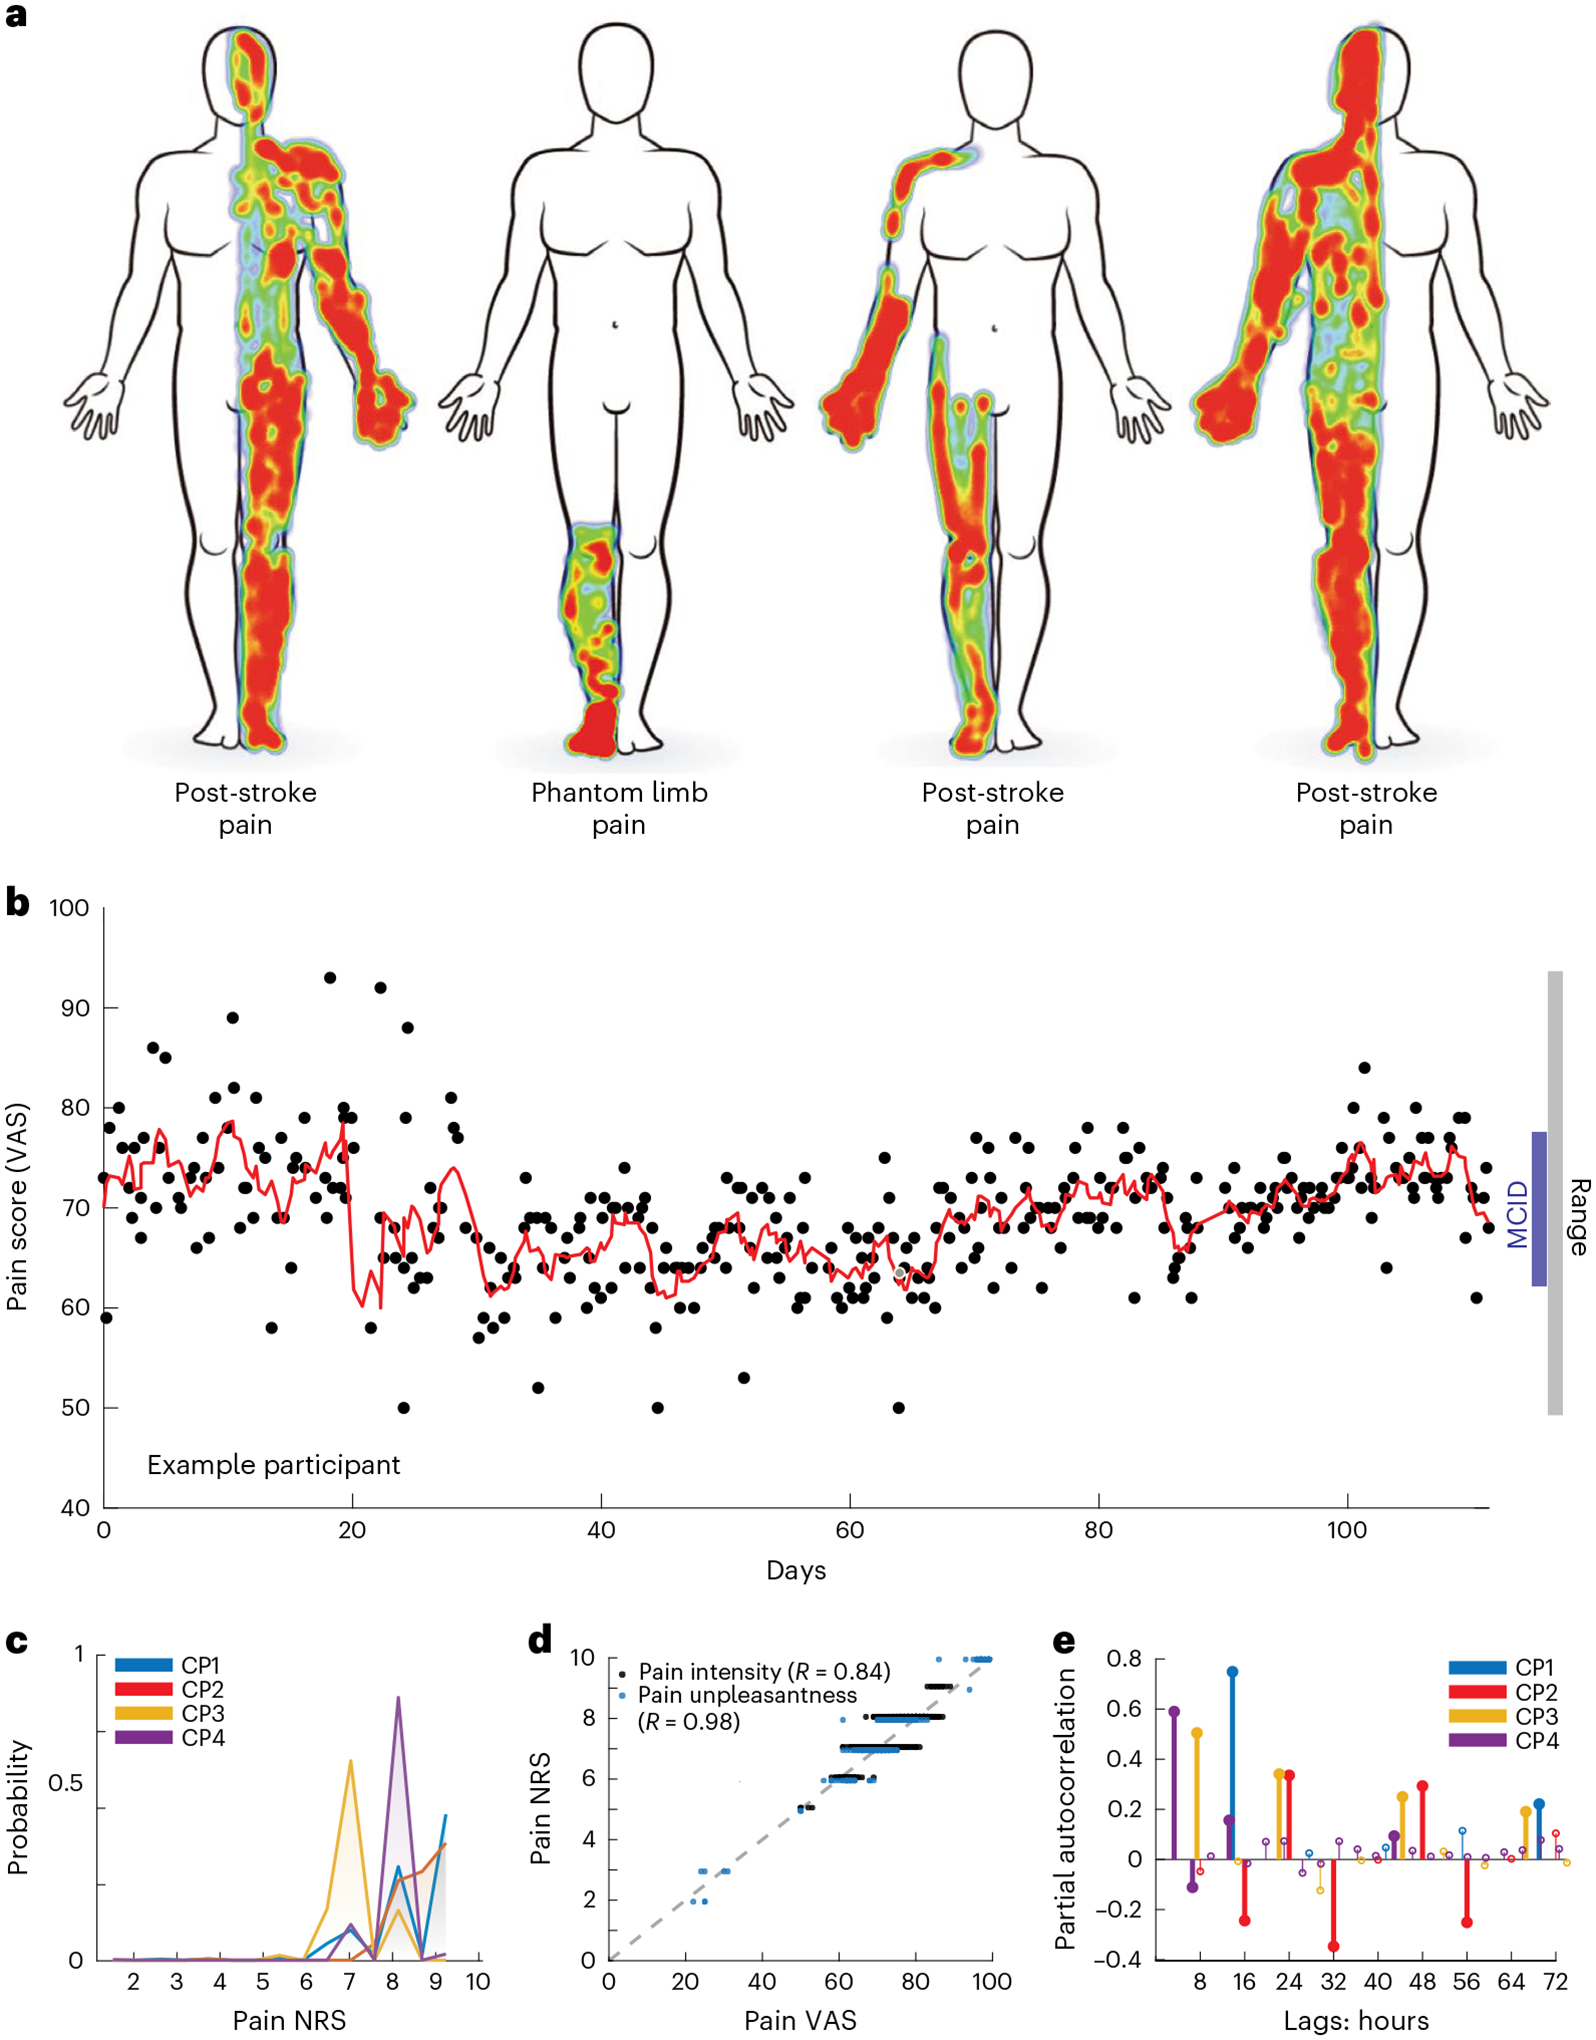
Fig. 1 |. Long-term ambulatory tracking of chronic pain metrics.

a, Self-drawn body maps corresponding to the anatomical distribution of each of four participants’ spontaneous chronic pain location. Red and blue indicate areas of high and low pain, respectively. b, Scatterplot of an example participant’s report of overall pain intensity VASs over 105 d (mean 3.2 reports/d), with overlying moving average (red line; window = 3 samples), demonstrating a range larger than MCID. Each black point represents one pain report simultaneous with a neural recording. c, Histogram of each participant’s reported pain intensity NRS; most values were high (>6/10) but similar across participants. d, Group data demonstrating high correlation between VAS and NRS for pain intensity and unpleasantness across participants who reported them (CP3–4) with associated Pearson’s correlation R. e, Partial autocorrelation stem plots for each participant’s pain NRSs. Different pain score reporting frequencies for each participant resulted in different autocorrelation resolution. Bold stems indicate time lags achieving statistical significance (P < 0.05) based on two-sided 95% confidence intervals (for CP1–4, respectively: ±0.12, 0.14, 0.13 and 0.09) not corrected for multiple comparisons.
