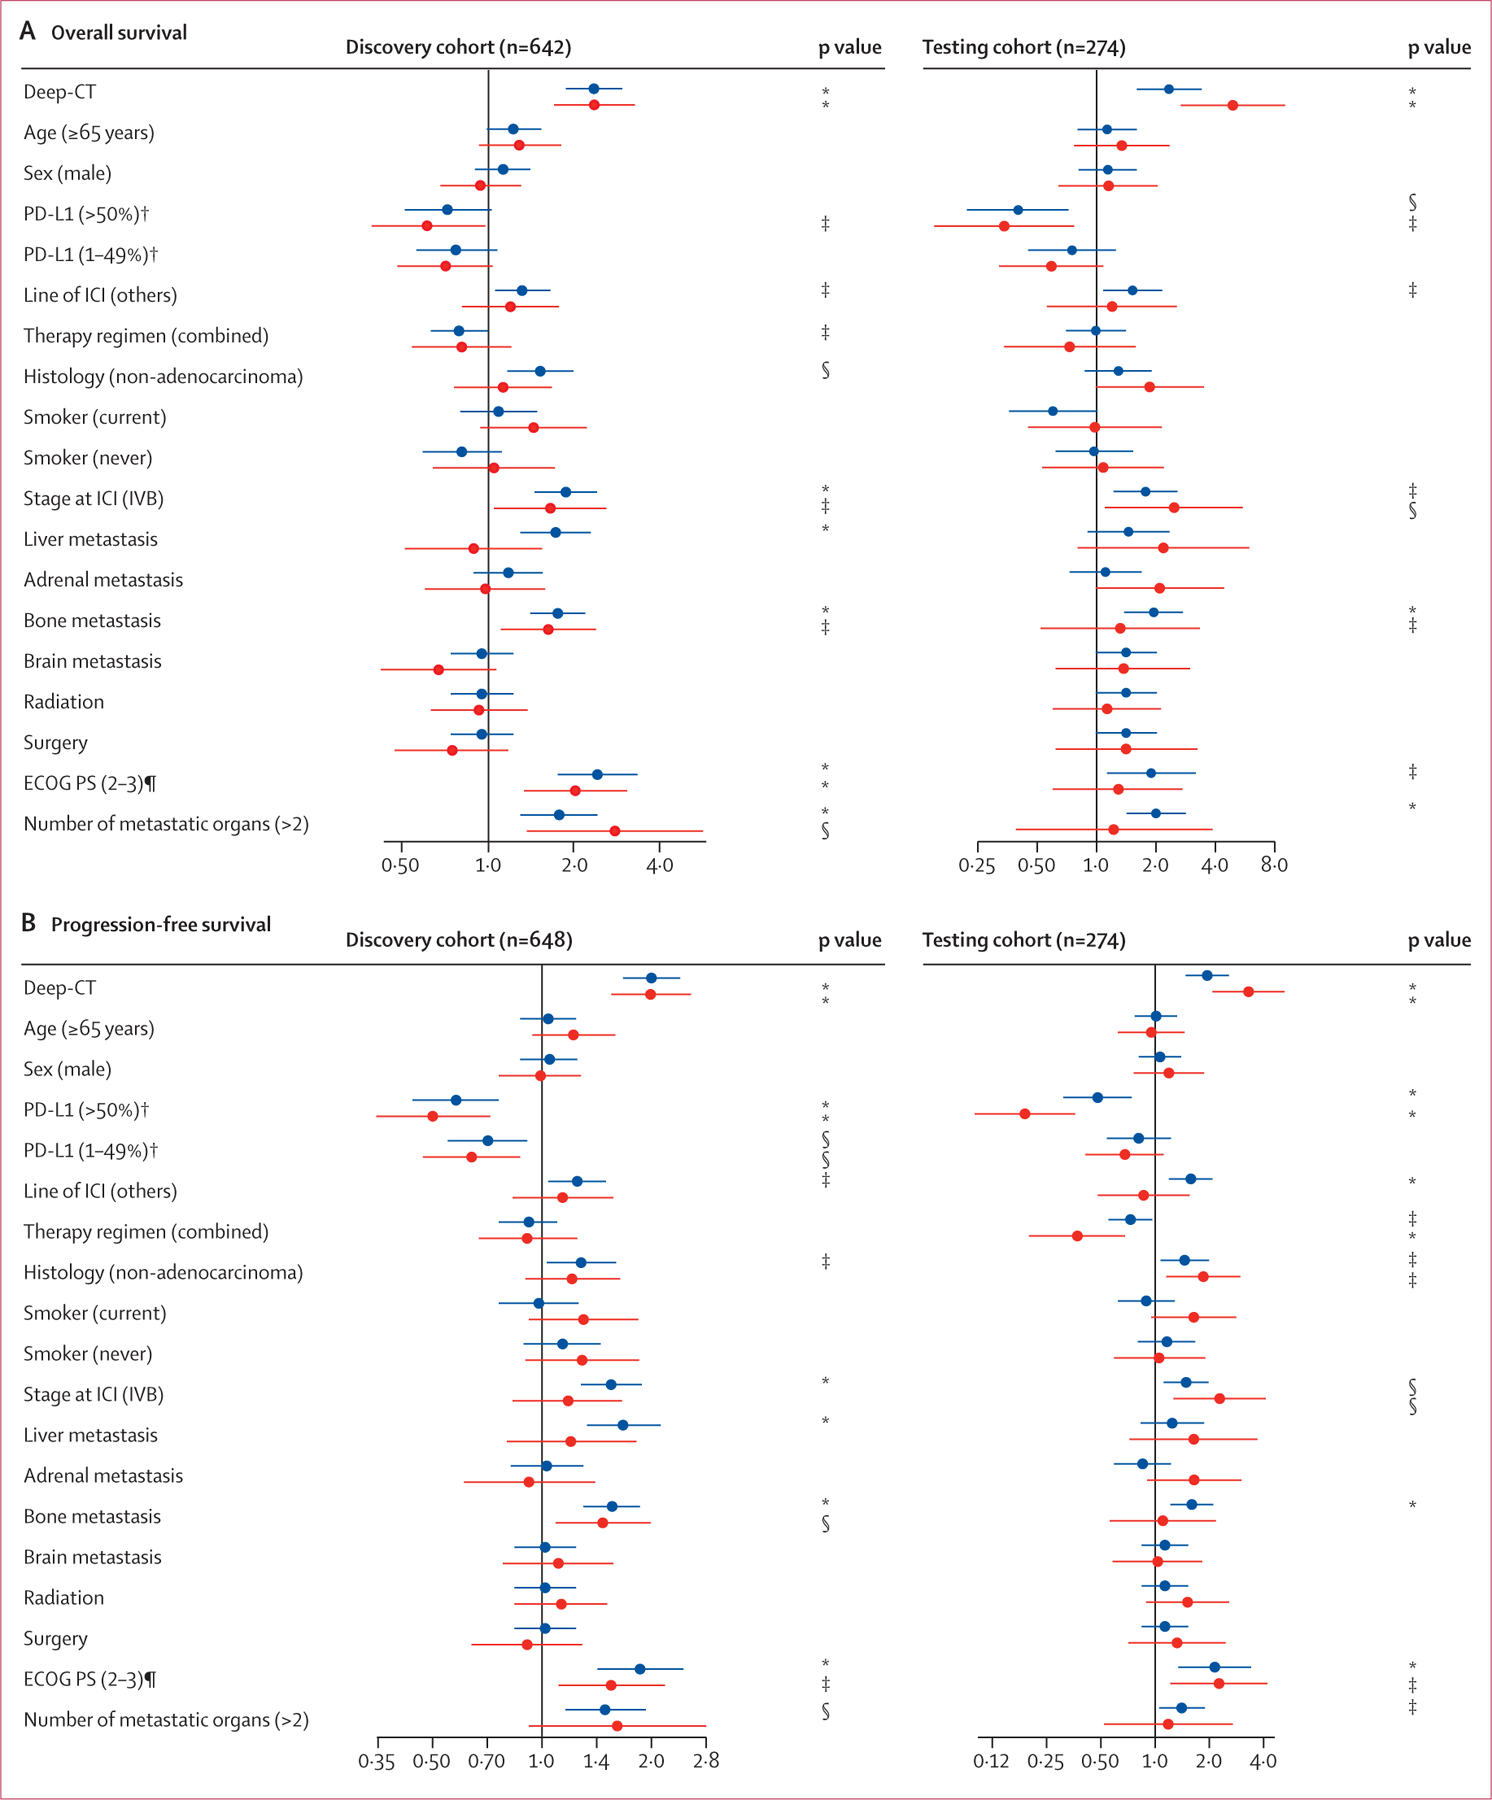
Figure 4: Evaluation of Deep-CT in clinical context.

Forest plots summarise the univariate and multivariate analyses for the CT-deep learning model. (A) Overall survival. (B) Progression-free survival. Blue data points are from univariate analysis. Red datapoints are from multivariate analysis. Multivariate analysis of progression-free survival used smaller cohort sizes in the discovery cohort (n=383) and the testing cohort (n=161) due to missing values. The exact p values are shown in the appendix (pp 25–26). ECOG PS=Eastern Cooperative Oncology Group Performance Status. ICI=immune checkpoint inhibitor. *p<0·001. †For overall survival, PD-L1 expression used smaller cohort sizes in the discovery cohort (n=463) and testing cohort (n=186) due to missing values. ‡p<0·05. §p<0·01. ¶For overall survival, ECOG PS used smaller cohort sizes in the discovery cohort (n=512) and testing cohort (n=221) due to missing values.
