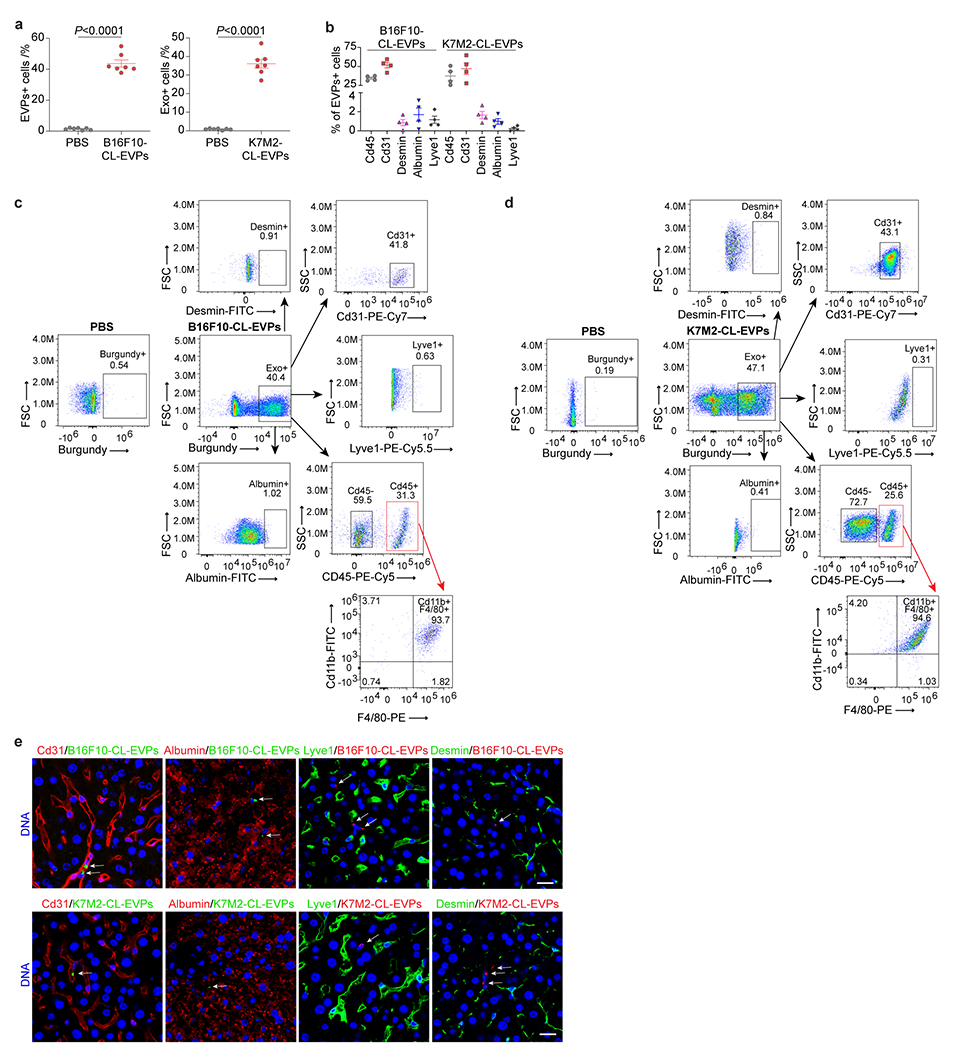
Extended Data Figure 7. Tumor-derived EVPs are uptaken by KCs in the liver.

a, Flow cytometry analysis of the percentage of EVP positive cells in the livers from mice 24 h post intravenous injection of 10 μg of CellVue Burgundy-labeled B16F10-CL-EVPs (left) and K7M2-CL-EVPs (right), and PBS controls. n=7 mice per group. b, Flow cytometry analysis of the percentage of different cell types, including Cd45+ immune cells, Cd31+ vascular endothelial cells, desmin+ stellate cells, albumin+ hepatocytes, Lyve1+ lymphatic and sinusoidal endothelial cells, among the B16F10-CL-EVP and K7M2-CL-EVP positive cells shown in a. n=4 each. c,d, Representative flow cytometry gating strategy evaluating the percentage of different cell types, including Cd31+ vascular endothelial cells, albumin+ hepatocytes, Lyve1+ lymphatic and sinusoidal endothelial cells, desmin+ stellate cells, Cd45+ immune cells and Cd11b+F4/80+ KCs in Cd45+ immune cells, among the B16F10-CL-EVP- (c) and K7M2-CL-EVP- (d) positive cells shown in (a,b and Fig. 3a). e, Representative images of the immunofluorescence (IF) co-staining of EVPs (indicated by white arrows) with Cd31+ vascular endothelial cells, albumin+ hepatocytes, Lyve1+ lymphatic and sinusoidal endothelial cells, and desmin+ stellate cells 24 h post intravenous injection of B16F10-CL-EVPs (top) or K7M2-CL-EVPs (bottom). DNA in blue. Scale bars, 20 μm. This experiment was repeated three times independently with similar results. P values were determined by the two-tailed, unpaired Student’s t-test (a).
