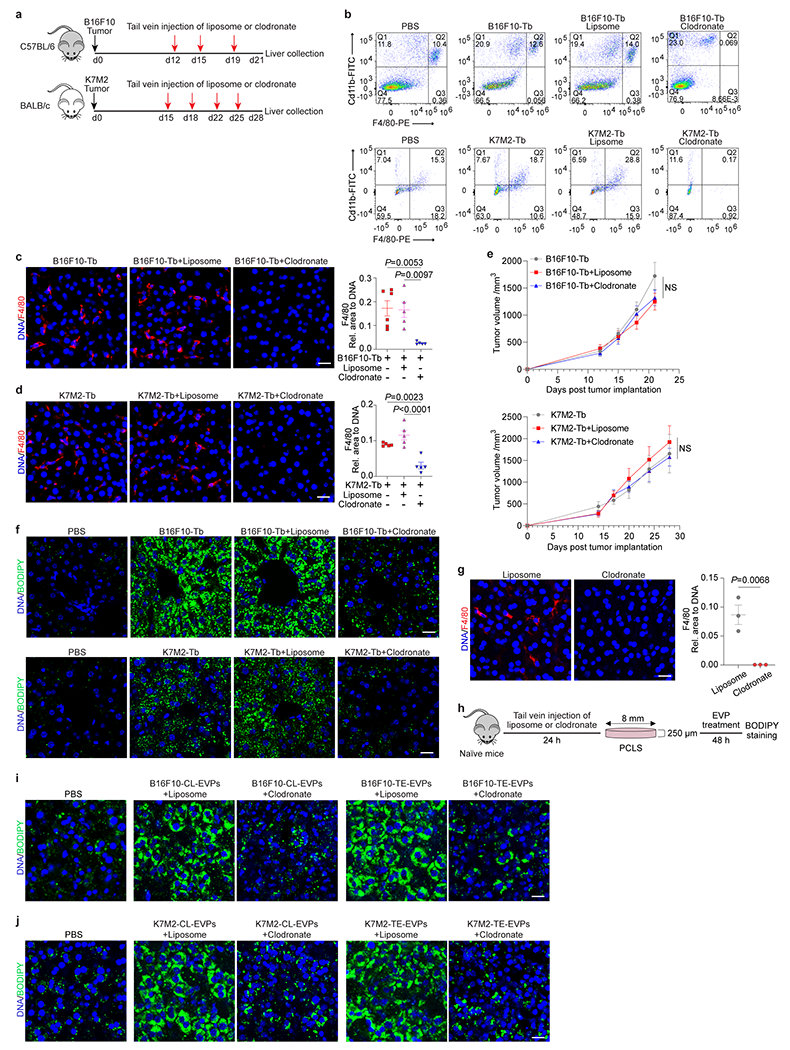
Extended Data Figure 8. Depletion of Kupffer cells alleviates tumor EVP-induced fatty liver formation without impairing tumor growth.

a, Schematic illustration of liposome or clodronate (100 μl of suspension per 10 g of mouse weight) treatment, delivered via intravenous injection to B16F10-Tb and K7M2-Tb mice. The concentration of clodronate in the suspension is 5 mg/ml. b, Representative flow cytometry gating strategy examining the abundance of KCs (Cd11b+F4/80+) in the livers from PBS-injected control mice, B16F10-Tb (up) or K7M2-Tb (bottom) mice, and tumor-bearing mice treated with liposome or clodronate. Associated quantification of KC abundance was shown in Fig. 3c. c,d, Representative IF images (left) and associated statistical analysis (right) of KC staining of the livers from B16F10-Tb (c) and K7M2-Tb (d) mice, and tumor-bearing mice treated with liposome or clodronate. F4/80 staining for KCs in red, and DNA in blue. For B16F10-Tb model, n=6 B16F10-Tb mice, n=5 B16F10-Tb mice treated with liposome or clodronate. For K7M2-Tb model, n=5 mice per group. e, Measurement of the tumor volumes from B16F10-Tb (left) or K7M2-Tb (right) mice, and tumor-bearing mice treated with liposome or clodronate as shown in (a). n=5 B16F10-Tb mice and n=7 B16F10-Tb mice treated with liposome or clodronate; n=3 K7M2-Tb mice and n=5 K7M2-Tb mice treated with liposome or clodronate. f, Representative IF images of BODIPY staining of the livers from PBS-injected control mice, B16F10- or K7M2-Tb mice, and the tumor-bearing mice treated with liposome or clodronate as shown in Fig. 3d. g, Representative IF images (left) and associated statistical analysis (right) of the precision-cut liver slices (PCLS) stained with F4/80 (red) and DAPI (blue) to show the KC depletion in mouse livers 24 h post treatment with liposome or clodronate (100 μl of suspension per 10 g of mouse weight). n=3 mice per group. h, Schematic illustration of precision-cut liver slices (PCLS) from naïve mice 24 h post treatment with liposome or clodronate (100 μl of suspension per 10 g of mouse weight) followed by EVP (10 μg/ml) treatment ex vivo for 48 h. Liver slices were then subjected to BODIPY staining. i,j, Representative IF images of BODIPY staining of PCLS sectioned from liposome- or clodronate- (100 μl of suspension per 10 g of mouse weight) treated mice (as shown in g) that were further treated with 10 μg/ml of B16F10-CL-EVPs or B16F10-TE-EVPs (i), K7M2-CL-EVPs or K7M2-TE-EVPs (j) ex vivo for 48 h (see also Fig. 3e,f). PCLS from naïve mice treated with PBS were used as controls. BODIPY in green and DNA in blue. Scale bars, 20 μm. P values were determined by the one-way ANOVA with post hoc Tukey’s test (c,d) , or two-way ANOVA followed with Bonferroni’s multiple comparisons test (e), or two-tailed, unpaired Student’s t-test (g). Data are mean ± s.e.m. NS, not significant.
