
Extended Data Figure 10. Tumor EVP-packaged palmitic acid (PA) induces TNFα secretion from KCs.
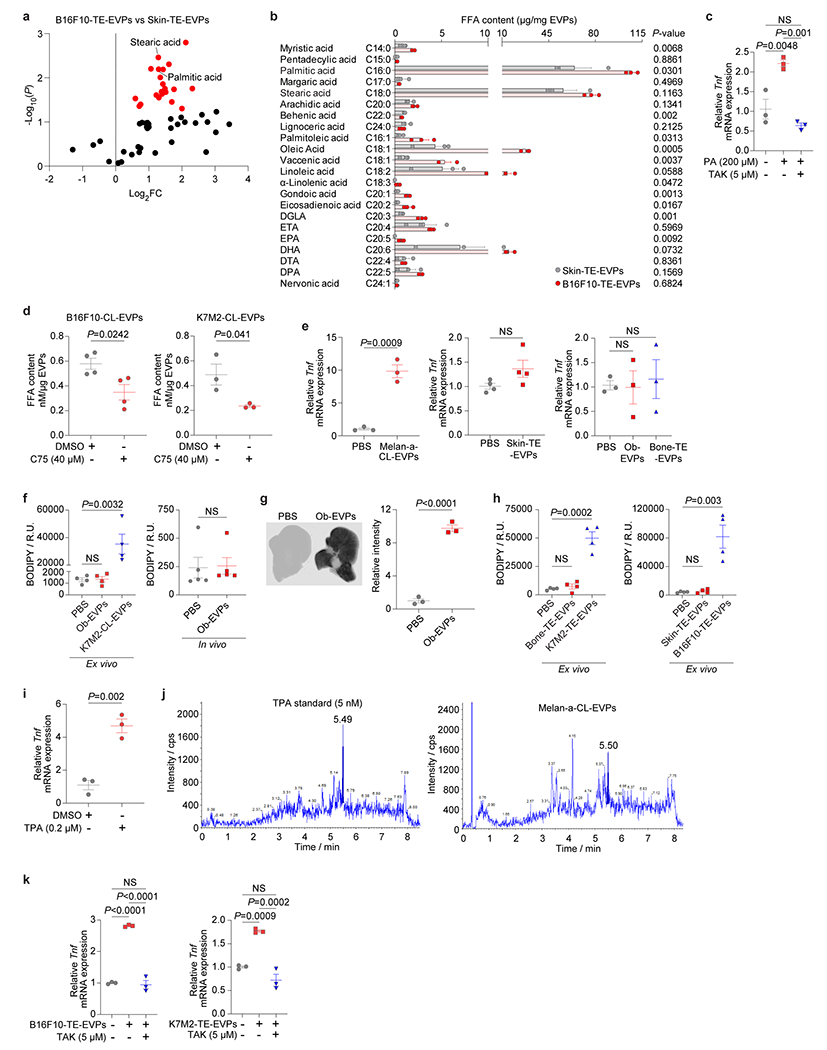
a, Volcano plot of metabolites significantly changed (highlighted in red, P<0.05) in B16F10-TE-EVPs versus skin-TE-EVPs. n=5 B16F10-TE-EVPs and n=4 skin-TE-EVPs. b, Quantitative MS analysis of the long-chain free fatty acids, including saturated and unsaturated fatty acids, in the B16F10-TE-EVPs and skin-TE-EVPs. n=3 per EVP group. c, qRT-PCR analysis of Tnf expression in KCs from naïve C57BL/6 mice treated with DMSO or the Tlr4 inhibitor TAK (5 μM) for 1 h followed by vehicle (100% ethanol diluted into PA-carrier medium at 1:1000 dilution) or 200 μM of PA with or without TAK (5 μM) for 4 h. n=3 mice per group. d, FFA content in the EVPs isolated from B16F10 (left) or K7M2 (right) cells treated with DMSO or C75 (40 μM) for 48 h. n=4 independent experiments for DMSO- or C75-treated B16F10 cells; n=3 independent experiments for DMSO- or C75-treated K7M2 cells. e, qRT-PCR analysis of Tnf expression in KCs isolated from naïve C57BL/6 (left and middle) or BALB/c (right) mice then treated with control PBS, Melan-a-CL-EVPs (left), skin-TE-EVPs (middle), osteoblast-EVPs (Ob-EVPs), or bone-TE-EVPs (right) in vitro for 4 h. n=3 independent experiments per group for treatment with Melan-a-CL-EVPs, Ob-EVPs, bone-TE-EVPs, and their PBS controls. n=4 independent experiments for treatment with skin-TE-EVPs and PBS. f, Quantification of BODIPY staining of precision-cut liver slices treated with Ob-EVPs or K7M2-CL-EVPs ex vivo for 48 h, or livers educated with Ob-EVPs in vivo for 4 weeks, compared to PBS-treated or PBS-educated controls, respectively. n=4 mice per group for ex vivo EVP treatment and n=5 mice per group for in vivo EVP education. g, Representative LI-COR Odyssey images (left) and associated statistical analysis of relative signal intensity (right) of the livers from mice 24 h post intravenously injection of 10 μg of CellVue NIR815-labeled Ob-EVPs and mock PBS control. n=3 mice per group. h, Quantification of BODIPY staining of the precision-cut liver slices treated with control PBS, bone-TE-EVPs or K7M2-TE-EVPs (left), skin-TE-EVPs or B16F10-TE-EVPs (right) ex vivo for 48 h. n=4 mice per group. i, qRT-PCR analysis of Tnf expression in the KCs isolated from C57BL/6 mice and treated with DMSO or 12-O-tetradecanoylphorbol-13-acetate (TPA) (0.2 μM) in vitro for 4 h. TPA induced KC Tnf expression, compared to DMSO control. n=3 independent experiments. j, Representative LC-MS/MS chromatograms of TPA standard (5 nM, left) and TPA detected in the Mela-a-CL-EVPs (right). The concentration of TPA detected in Mela-a-CL-EVPs was 6.5 nM per 100 μg of EVPs. k, qRT-PCR analysis of Tnf expression in KCs which were pre-treated with DMSO or TAK (5 μM) for 1 h, and subsequently treated with PBS, 10 μg of B16F10-TE-EVPs or K7M2-TE-EVPs with or without TAK (5 μM) for 4 h. n=3 independent experiments. P values were determined by the two-tailed, unpaired Student’s t-test (a,b,d-i,k), or one-way ANOVA with post hoc Tukey’s test (c), or Data are mean ± s.e.m. NS, not significant.