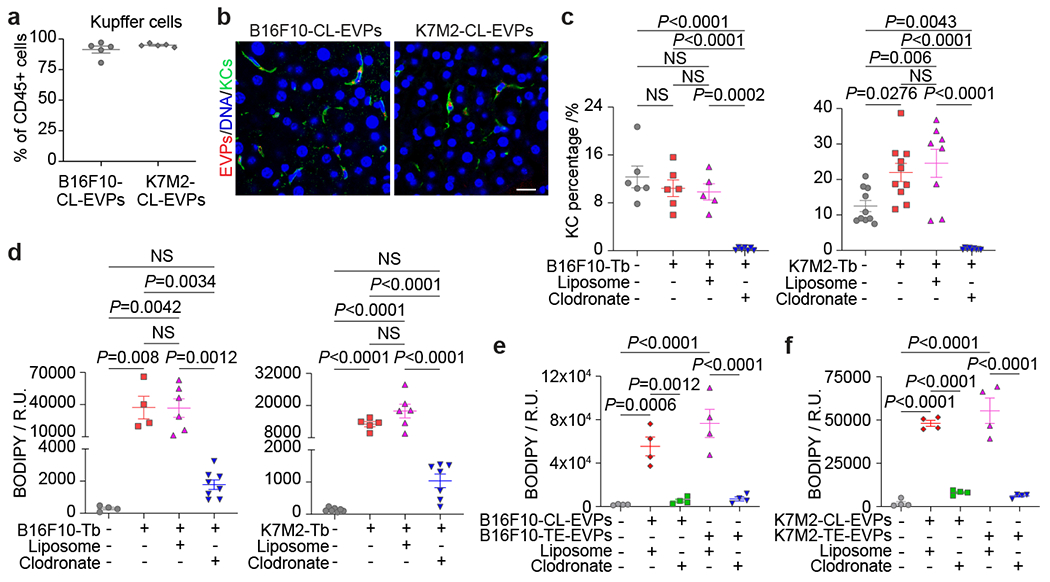
Figure 3. Uptake of tumor-derived EVPs by KCs induces fatty liver formation.

a, Flow cytometry analysis of the percentage of KCs in the Cd45+ immune cells. n=5 each. b, Representative immunofluorescence images of the co-localization of KCs (green) and B16F10-CL-EVPs (red, left), or K7M2-CL-EVPs (red, right). DNA in blue. Scale bar, 20 μm. This experiment was repeated three times independently with similar results. c,d, Flow cytometry analysis of the percentage of KCs (c) and quantification of BODIPY staining (d) in the livers from PBS-injected control mice, B16F10- or K7M2-Tb mice, and the tumor-bearing mice treated with liposome or clodronate as illustrated in Extended Data Fig. 8a. In (c), B16F10-Tb model (n=6 controls and Tb mice, n=5 Tb mice treated with liposome, n=7 Tb mice treated with clodronate); K7M2-Tb model (n=10 controls and Tb mice, n=8 Tb mice treated with liposome, n=9 Tb mice treated with clodronate). In (d), B16F10-Tb model (n=4 controls and Tb mice, n=6 Tb mice treated with liposome, n=8 Tb mice treated with clodronate); K7M2-Tb model (n=7 controls, n=5 Tb mice, n=6 Tb mice treated with liposome, n=7 Tb mice treated with clodronate). e,f, Quantification of the BODIPY staining of precision-cut liver slices from liposome- or clodronate- treated mice after treatment with B16F10-CL-EVPs or B16F10-TE-EVPs (e), or K7M2-CL-EVPs or K7M2-TE-EVPs (f), following the procedure illustrated in Extended Data Fig. 8h. n=4 each. P values were determined by the one-way ANOVA with Tukey’s test (c-f). Data are mean ± s.e.m. NS, not significant.
