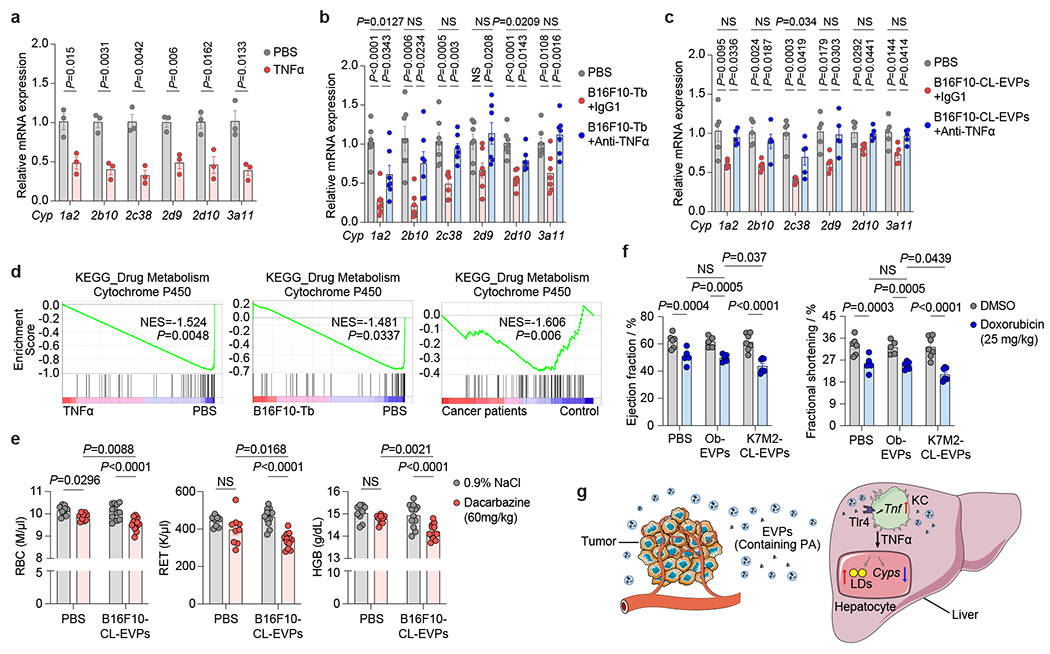
Figure 5. Tumor EVPs suppress liver drug metabolism and enhance chemotoxicity.

a, qRT-PCR analysis of the expression of Cyp genes in the primary hepatocytes treated with PBS or recombinant murine TNFα protein (25 ng/ml) for 24 h. n=3 independent experiments. b,c, qRT-PCR analysis of the expression of Cyp genes in hepatocytes isolated from B16F10-Tb mice (n=7) (b) and B16F10-CL-EVP-educated mice (n=5) (c) treated with anti-TNFα antibody or IgG1 isotype control, compared to their respective PBS-injected controls. d, GSEA of gene expression profiles in the TNFα-treated murine primary hepatocytes (top), in the livers from B16F10-Tb mice (middle) and cancer patients (bottom), compared to their respective controls. n=3 per group for TNFα treatment and B16F10-Tb mice, and PBS controls; n=5 cancer patients and n=8 control subjects. e, Analysis of red blood cell (RBC), reticulocyte (RET) and hemoglobin (HGB) counts in PBS- (n=9) or B16F10-CL-EVP-educated mice (n=12) after treatment with dacarbazine (60 mg/kg) or 0.9% NaCl. f, Analysis of left ventricular ejection fraction and fractional shortening (M-mode) in PBS-, osteoblast (Ob)-EVP-, or K7M2-CL-EVP-educated mice after treatment of doxorubicin (cumulative dose of 25 mg/kg) or DMSO. PBS groups (n=6), K7M2-CL-EVP groups (n=7), Ob-EVP group treated with DMSO (n=5) or doxorubicin (n=6). g, A schematic illustration of the working model. Tumor-derived EVPs specifically target KCs in the liver. EVP-packaged saturated fatty acids, such as palmitic acid (PA), stimulate the secretion of TNFα from KCs depending on Tlr4 functional integrity. This produces a pro-inflammatory microenvironment in the liver, thereby systemically inducing fatty liver formation and suppressing the drug-metabolizing activity of the liver. P values were determined by the two-tailed, unpaired t-test (a), one-way ANOVA with Tukey’s test (b,c), or two-way ANOVA with Fisher’s LSD test (e,f). Data are mean ± s.e.m. NS, not significant. LDs, lipid droplets.
