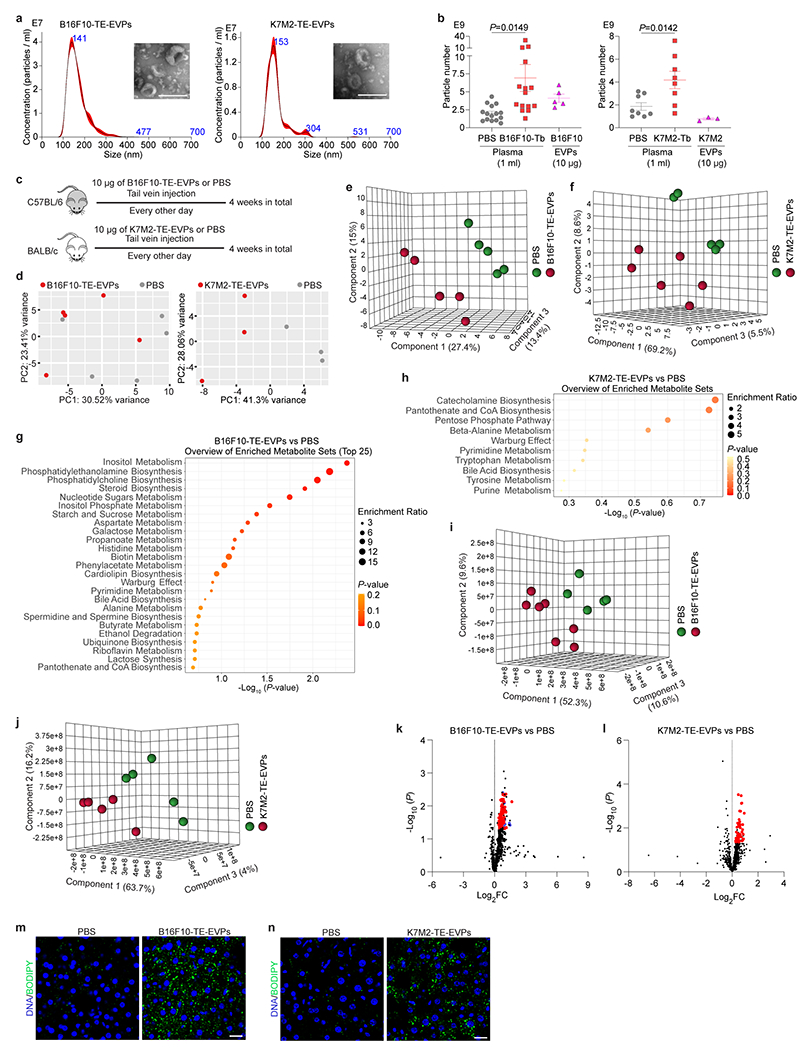
Extended Data Figure 4. Tumor explant (TE)-derived EVPs dysregulate liver metabolism.

a, Representative nanoparticle tracking analysis (NTA) and TEM images (insertions) of B16F10-TE-EVPs (left) and K7M2-TE-EVPs (right). Shown are graphs and images representative of three independent experiments. b, Quantification of the particle numbers in 1 ml of plasma from B16F10-Tb (left) and K7M2-Tb (right) mice, compared to their PBS-injected controls, as well as in 10 μg of EVPs derived from B16F10 (left) and K7M2 (right) cells. n=15 control and B16F10-Tb mice; n=8 control and K7M2-Tb mice; n=5 and n=3 independent experiments for EVPs derived from B16F10 and K7M2 cells, respectively. c, Schematic illustration of the procedure of syngeneic mouse education with B16F10-TE-EVPs or K7M2-TE-EVPs, and PBS control. d, PCA of gene expression in the livers of mice educated with B16F10-TE-EVPs (left) and K7M2-TE-EVPs (right), compared to PBS-educated controls. n=5 mice per group for B16F10-TE-EVP education model; n=3 mice per group for K7M2-TE-EVP education model. e,f, PLS-DA plots of metabolites detected in the livers from B16F10-TE-EVP- (e) and K7M2-TE-EVP- (f) educated mice, compared to PBS-educated controls. Metabolomics data are shown in Supplementary Tables 8 and 9. n=5 B16F10-TE-EVP-educated mice and controls; n=6 K7M2-TE-EVP-educated mice and n=5 controls. g,h, Metabolite set enrichment analysis of the metabolites significantly changed in the livers from B16F10-TE-EVP- (g) and K7M2-TE-EVP- (h) educated mice, compared to PBS-educated controls (see lists of metabolites in Fig. 2e,f). n=5 B16F10-TE-EVP-educated mice and controls; n=6 K7M2-TE-EVP-educated mice and n=5 controls. i,j, PLS-DA plots of the lipid species in the livers from B16F10-TE-EVP- (i) and K7M2-TE-EVP- (j) educated mice, compared to PBS-educated controls. Lipidomics data are shown in Supplementary Tables 10 and 11. n=7 B16F10-TE-EVP-educated mice and n=5 controls; n=5 K7M2-TE-EVP-educated mice and controls. k,l, Volcano plots showing the significantly (P<0.05) enriched triglyceride species (red) and cholesteryl ester species (blue) in the livers from B16F10-TE-EVP- (k) and K7M2-TE-EVP- (l) educated mice, compared to PBS-educated controls. n=7 B16F10-TE-EVP-educated mice and n=5 controls; n=5 K7M2-TE-EVP-educated mice and controls. m,n, Representative images of BODIPY staining of the livers from B16F10-TE-EVP- (m) and K7M2-TE-EVP- (n) educated mice, and PBS-educated controls. Associated quantification of BODIPY staining was shown in Fig. 2i,j. Scale bars, 200 nm for (a) and 20 μm for (m,n). P values were determined by the two-tailed, unpaired Student’s t-test (b,k,l), or hypergeometric test (g,h). Data are mean ± s.e.m.
