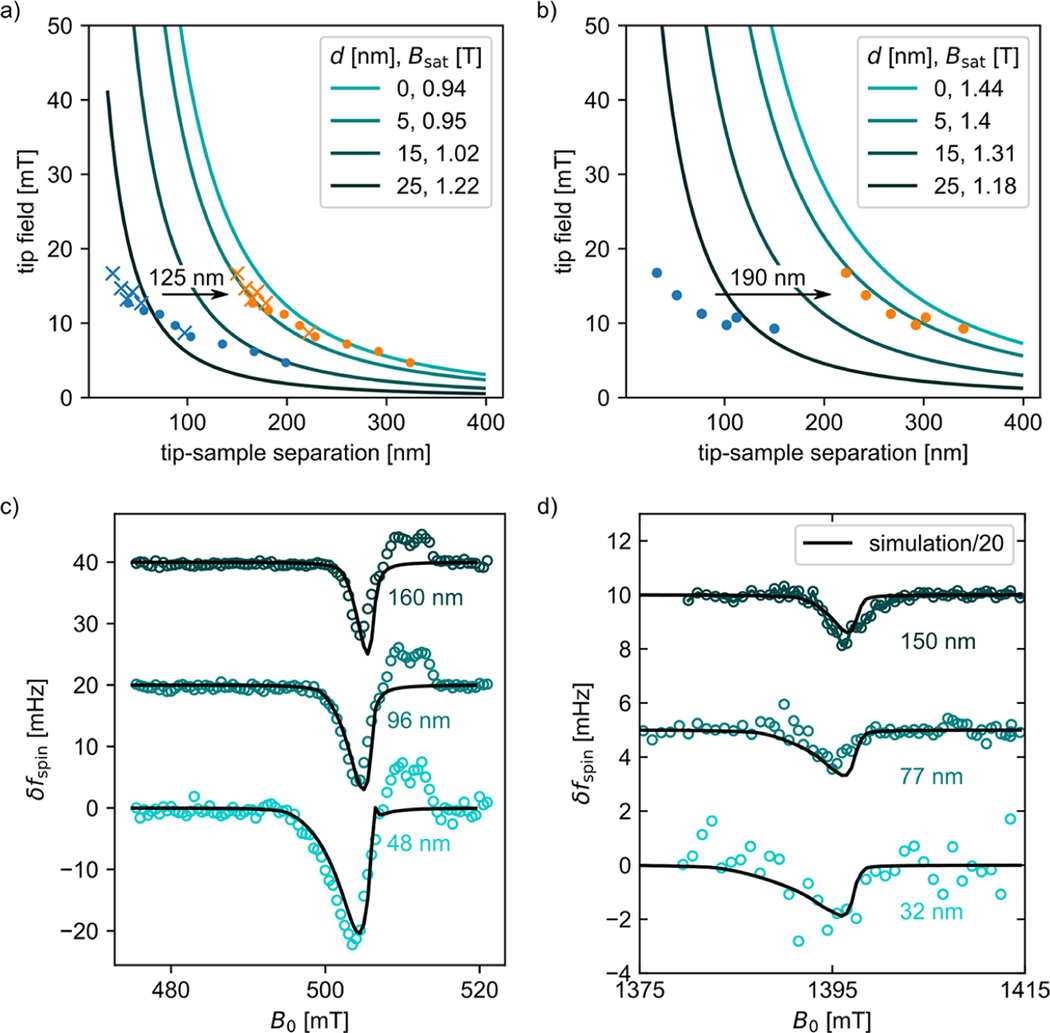
Figure 7.
A damage layer partially explains the electron-spin resonance signal’s dependence on tip–sample separation and magnetic field. Measured magnet tip field vs tip–sample separation for the experiment in (a) Figure 6(a) and (b) Figure 3(a). Solid lines are tip-field models obtained from analysis of magnetometry data, Figure S1 and Tables S2 and S3, with the assumed uniform magnet damage layer thickness and tip saturation magnetization indicated. Blue circles and crosses are measured data. Orange circles and crosses are the data expected for in (a) and in (b). (c, d) Measured (circles) and calculated (lines) electron-spin resonance signal vs magnetic field at various tip–sample separations, assuming and in (c) and in (d). The simulation in (d) was divided by a factor of 20 to match the experimental signal.

