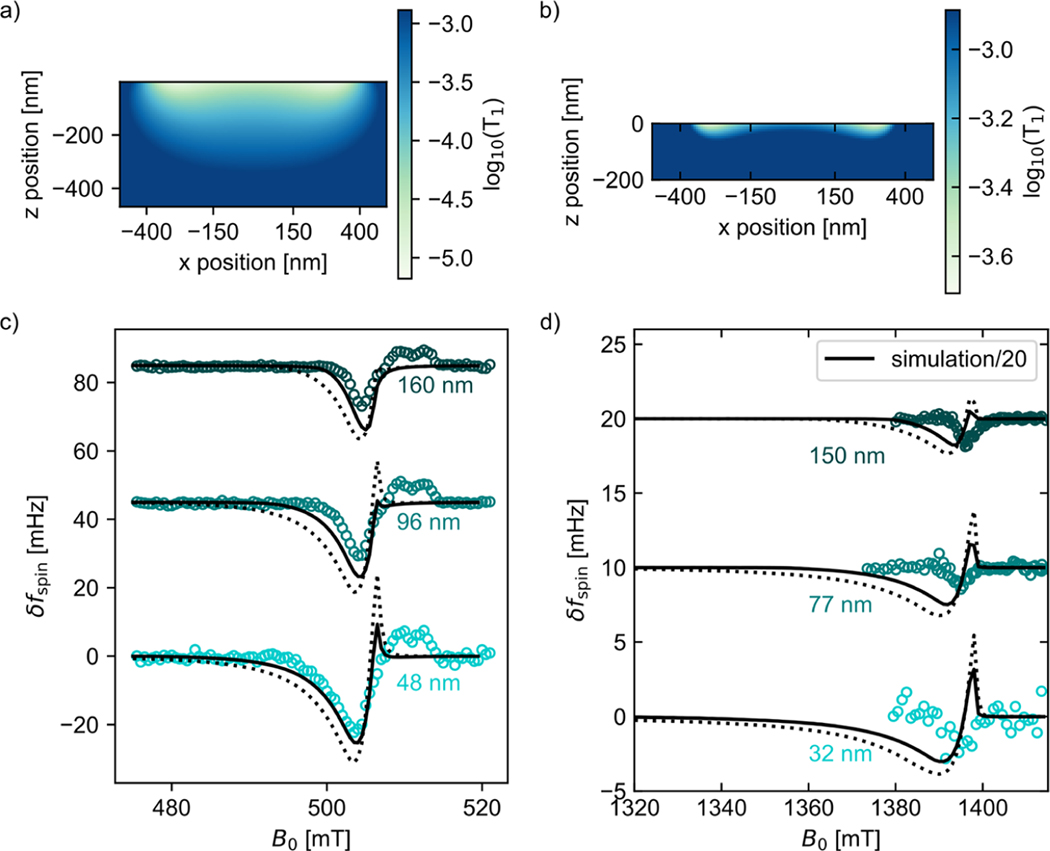
Figure 8.
A spatially dependent sample , due to tip magnetization fluctuations, partially explains the electron-spin resonance signal’s dependence on tip–sample separation and magnetic field. Cross-sectional plot of sample calculated for (a) the Figure 6(a) experiment at (cantilever A, assuming and ) and (b) the Figure 3(a) experiment at (cantilever B, assuming and ). (c, d) Observed (circles) and calculated (lines) electron-spin resonance signal vs magnetic field. The dotted-line calculation assumes no damage layer. The solid-line calculation assumes . The simulation in (d) was divided by a factor of 20 to match the experimental signal.

